3322 Edgecreek Dr Houston, TX 77066
Champions NeighborhoodEstimated Value: $204,000 - $211,000
3
Beds
2
Baths
1,428
Sq Ft
$145/Sq Ft
Est. Value
About This Home
This home is located at 3322 Edgecreek Dr, Houston, TX 77066 and is currently estimated at $207,480, approximately $145 per square foot. 3322 Edgecreek Dr is a home located in Harris County with nearby schools including Griggs EC/PK/K, Conley Elementary School, and Plummer Middle School.
Ownership History
Date
Name
Owned For
Owner Type
Purchase Details
Closed on
May 30, 2013
Sold by
The Secretary Of Hud
Bought by
Tran Vu Thanh and Ma Lin Thi
Current Estimated Value
Home Financials for this Owner
Home Financials are based on the most recent Mortgage that was taken out on this home.
Original Mortgage
$42,105
Interest Rate
3.41%
Mortgage Type
Purchase Money Mortgage
Purchase Details
Closed on
Jun 8, 2012
Sold by
Flagstar Bank Fsb
Bought by
Secretary Of Hud
Purchase Details
Closed on
May 28, 2010
Sold by
Pritchett Harold Leonard and Pritchett Lillian Ann
Bought by
Garcia Jorge and Jimenez Gloria
Home Financials for this Owner
Home Financials are based on the most recent Mortgage that was taken out on this home.
Original Mortgage
$87,878
Interest Rate
5.62%
Mortgage Type
FHA
Purchase Details
Closed on
Mar 23, 1999
Sold by
Clemons Andrea Nichole and Watty Andrea Nichole Clemons
Bought by
Watty Ronald Steve
Create a Home Valuation Report for This Property
The Home Valuation Report is an in-depth analysis detailing your home's value as well as a comparison with similar homes in the area
Home Values in the Area
Average Home Value in this Area
Purchase History
| Date | Buyer | Sale Price | Title Company |
|---|---|---|---|
| Tran Vu Thanh | -- | None Available | |
| Secretary Of Hud | -- | None Available | |
| Garcia Jorge | -- | None Available | |
| Watty Ronald Steve | -- | Stewart Title |
Source: Public Records
Mortgage History
| Date | Status | Borrower | Loan Amount |
|---|---|---|---|
| Closed | Tran Vu Thanh | $42,105 | |
| Previous Owner | Garcia Jorge | $87,878 |
Source: Public Records
Tax History Compared to Growth
Tax History
| Year | Tax Paid | Tax Assessment Tax Assessment Total Assessment is a certain percentage of the fair market value that is determined by local assessors to be the total taxable value of land and additions on the property. | Land | Improvement |
|---|---|---|---|---|
| 2025 | $3,796 | $208,095 | $37,808 | $170,287 |
| 2024 | $3,796 | $211,292 | $37,808 | $173,484 |
| 2023 | $3,796 | $227,374 | $37,808 | $189,566 |
| 2022 | $1,622 | $191,708 | $24,874 | $166,834 |
| 2021 | $3,843 | $165,210 | $24,874 | $140,336 |
| 2020 | $3,800 | $152,407 | $24,874 | $127,533 |
| 2019 | $3,598 | $128,910 | $13,266 | $115,644 |
| 2018 | $1,114 | $105,000 | $13,266 | $91,734 |
| 2017 | $2,887 | $105,000 | $13,266 | $91,734 |
| 2016 | $2,625 | $116,171 | $13,266 | $102,905 |
| 2015 | $2,207 | $102,141 | $13,266 | $88,875 |
| 2014 | $2,207 | $70,055 | $13,266 | $56,789 |
Source: Public Records
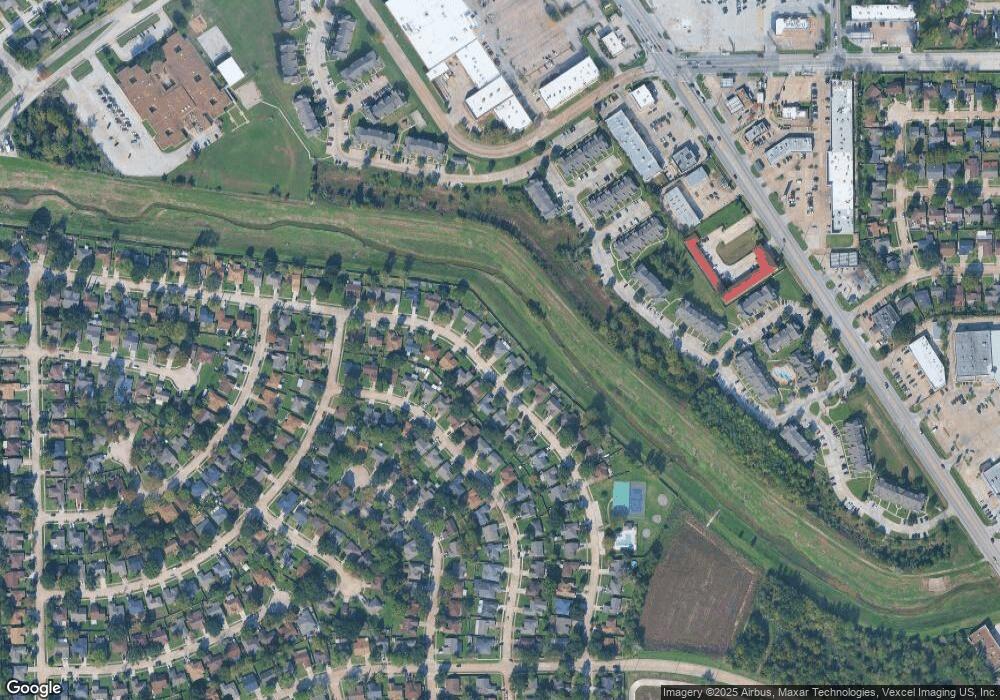
Map
Nearby Homes
- 14118 Magnolia Springs Dr
- 3407 Sandbrook Dr
- 14003 Valley Grove Dr
- 14207 Timberhaven Dr
- 3230 Hombly Rd
- 2606 Owens Cross Dr
- 12207 Mckamy Dr
- 12114 Mckamy Dr
- 2503 Hazyknoll Ln
- 10915 Meadow Walk Ln
- 2410 Irish Spring Dr
- 11322 Yorklyn Dr
- 13803 Bearwood Rd
- 2315 Tomlinson Trail Dr
- 2919 Sunwood Dr
- 2222 Irish Spring Dr
- 2322 Hadden Hollow Dr
- 2507 W Greens Rd
- 3519 Hombly Rd
- 11335 Chelsea Walk Dr
- 3326 Edgecreek Dr
- 3318 Edgecreek Dr
- 3330 Edgecreek Dr
- 3314 Edgecreek Dr
- 3323 Edgecreek Dr
- 3319 Edgecreek Dr
- 3327 Edgecreek Dr
- 3310 Edgecreek Dr
- 3315 Edgecreek Dr
- 3334 Edgecreek Dr
- 3335 Edgecreek Dr
- 3311 Edgecreek Dr
- 3306 Edgecreek Dr
- 14158 Whispering Palms Dr
- 3338 Edgecreek Dr
- 14154 Whispering Palms Dr
- 14162 Whispering Palms Dr
- 3339 Edgecreek Dr
- 3307 Edgecreek Dr
- 14150 Whispering Palms Dr