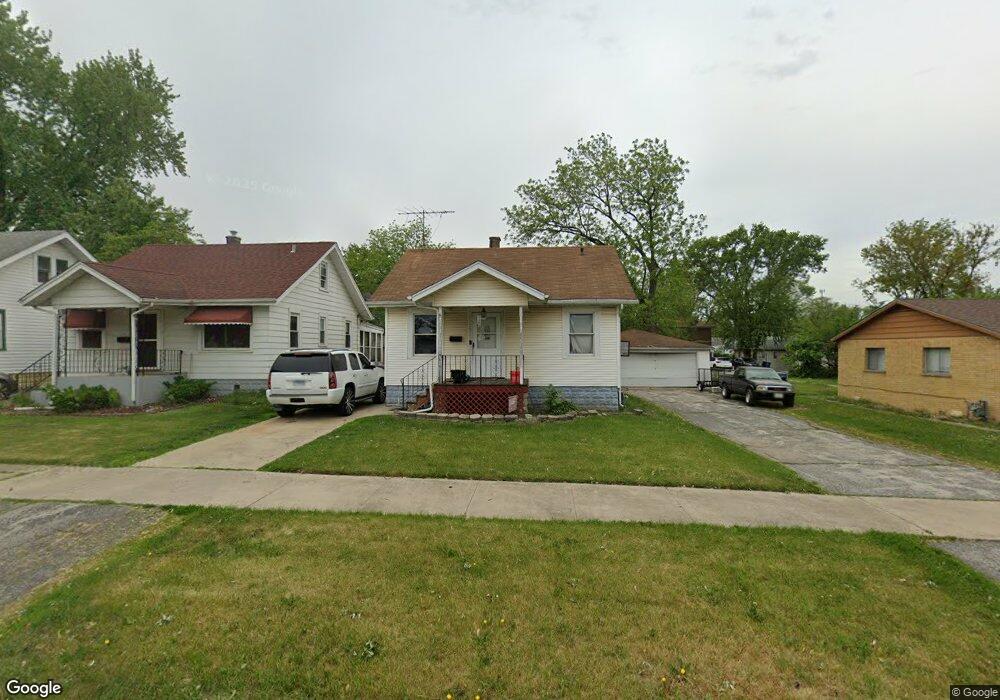
3322 Halsted St Steger, IL 60475
Estimated Value: $194,000
Studio
--
Bath
--
Sq Ft
31,363
Sq Ft Lot
About This Home
This home is located at 3322 Halsted St, Steger, IL 60475 and is currently estimated at $194,000. 3322 Halsted St is a home located in Cook County with nearby schools including Steger Primary Center, Steger Intermediate Center, and Columbia Central School.
Ownership History
Date
Name
Owned For
Owner Type
Purchase Details
Closed on
May 31, 2013
Sold by
Bader Islam Badar and Bader Islam
Bought by
Islam Badar and Badar Hissan
Current Estimated Value
Purchase Details
Closed on
May 16, 2012
Sold by
Ansburg Rashelle
Bought by
Federal National Mortgage Association
Purchase Details
Closed on
Dec 24, 2002
Sold by
Ansburg Rashelle and Pikorz Rashelle
Bought by
Pikorz Rashelle
Home Financials for this Owner
Home Financials are based on the most recent Mortgage that was taken out on this home.
Original Mortgage
$96,000
Interest Rate
6.3%
Purchase Details
Closed on
May 23, 2001
Sold by
Anderson Charles
Bought by
Ansburg Rashelle
Home Financials for this Owner
Home Financials are based on the most recent Mortgage that was taken out on this home.
Original Mortgage
$94,090
Interest Rate
7.07%
Create a Home Valuation Report for This Property
The Home Valuation Report is an in-depth analysis detailing your home's value as well as a comparison with similar homes in the area
Home Values in the Area
Average Home Value in this Area
Purchase History
| Date | Buyer | Sale Price | Title Company |
|---|---|---|---|
| Islam Badar | -- | None Available | |
| Federal National Mortgage Association | -- | None Available | |
| Pikorz Rashelle | -- | -- | |
| Ansburg Rashelle | $97,000 | Ticor Title |
Source: Public Records
Mortgage History
| Date | Status | Borrower | Loan Amount |
|---|---|---|---|
| Previous Owner | Pikorz Rashelle | $96,000 | |
| Previous Owner | Ansburg Rashelle | $94,090 |
Source: Public Records
Tax History
| Year | Tax Paid | Tax Assessment Tax Assessment Total Assessment is a certain percentage of the fair market value that is determined by local assessors to be the total taxable value of land and additions on the property. | Land | Improvement |
|---|---|---|---|---|
| 2025 | $572 | $1,728 | $1,094 | $634 |
| 2024 | $572 | $1,728 | $1,094 | $634 |
| 2023 | $604 | $1,728 | $1,094 | $634 |
| 2022 | $604 | $1,493 | $859 | $634 |
| 2021 | $564 | $1,492 | $859 | $633 |
| 2020 | $553 | $1,492 | $859 | $633 |
| 2019 | $511 | $1,414 | $781 | $633 |
| 2018 | $494 | $1,414 | $781 | $633 |
| 2017 | $500 | $1,414 | $781 | $633 |
| 2016 | $478 | $1,336 | $703 | $633 |
| 2015 | $476 | $1,336 | $703 | $633 |
| 2014 | $475 | $1,336 | $703 | $633 |
| 2013 | $434 | $1,336 | $703 | $633 |
Source: Public Records
Map
Nearby Homes
- 3439 Sangamon St
- 3505 Peoria St
- 165 W 34th St
- 3121 Chicago Rd
- 3117 Chicago Rd
- 28 W 35th Place
- 3035 Peoria St
- 3333 Union Ave
- 3117 Carpenter St
- 13 W 30th Place
- 3609 Peoria St
- 3617 Peoria St
- 37 W 36th Place
- 3515 Union Ave
- 3107 Union Ave
- 3341 Fairview Ave
- 3634 Sangamon St
- 3436 Sally Dr
- 3448 Sally Dr
- 39 Mckinley Ave
- 3322 Halsted St
- 3314 Halsted St
- 3314 Halsted St
- 3324 Halsted St
- 3310 Halsted St
- 3310 Halsted St
- 3326 Halsted St
- 3319 Green St
- 3319 Green St
- 3317 Green St
- 3328 Halsted St
- 3328 Halsted St
- 3306 Halsted St
- 3306 Halsted St
- 3311 Green St
- 3325 Green St
- 3325 Green St
- 3325 Green St
- 3305 Green St
- 3305 Green St
Your Personal Tour Guide
Ask me questions while you tour the home.