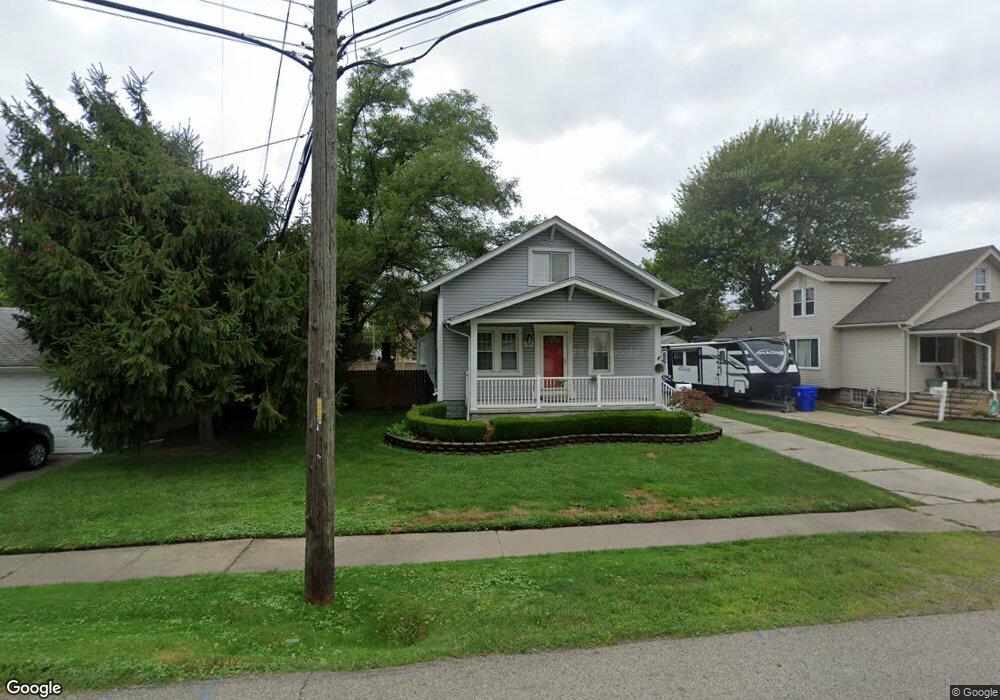
33221 Duncan Fraser, MI 48026
Estimated Value: $200,853 - $264,000
3
Beds
2
Baths
1,350
Sq Ft
$175/Sq Ft
Est. Value
About This Home
This home is located at 33221 Duncan, Fraser, MI 48026 and is currently estimated at $236,463, approximately $175 per square foot. 33221 Duncan is a home located in Macomb County with nearby schools including Thomas A. Edison Elementary School, Richards Middle School, and Fraser High School.
Ownership History
Date
Name
Owned For
Owner Type
Purchase Details
Closed on
Jul 9, 2010
Sold by
1836 Brys Llc
Bought by
Campbell Jeremiah J
Current Estimated Value
Home Financials for this Owner
Home Financials are based on the most recent Mortgage that was taken out on this home.
Original Mortgage
$59,900
Interest Rate
7%
Mortgage Type
Seller Take Back
Purchase Details
Closed on
Feb 23, 2010
Sold by
Savoy Jon G and Savoy Susan M
Bought by
1836 Brys Llc
Purchase Details
Closed on
Oct 9, 2009
Sold by
Ippolito Dominic and Ippolito Amy
Bought by
Savoy Jon
Purchase Details
Closed on
Jun 30, 2005
Sold by
Golabek Martin P and Golabek Tammie Jo
Bought by
Ippolito Dominic
Create a Home Valuation Report for This Property
The Home Valuation Report is an in-depth analysis detailing your home's value as well as a comparison with similar homes in the area
Home Values in the Area
Average Home Value in this Area
Purchase History
| Date | Buyer | Sale Price | Title Company |
|---|---|---|---|
| Campbell Jeremiah J | $84,900 | None Available | |
| Campbell Jeremiah J | $84,900 | None Available | |
| 1836 Brys Llc | -- | None Available | |
| Savoy Jon | $24,317 | None Available | |
| Ippolito Dominic | $169,000 | Metropolitan Title Company |
Source: Public Records
Mortgage History
| Date | Status | Borrower | Loan Amount |
|---|---|---|---|
| Previous Owner | Campbell Jeremiah J | $59,900 |
Source: Public Records
Tax History
| Year | Tax Paid | Tax Assessment Tax Assessment Total Assessment is a certain percentage of the fair market value that is determined by local assessors to be the total taxable value of land and additions on the property. | Land | Improvement |
|---|---|---|---|---|
| 2025 | $3,731 | $95,200 | $0 | $0 |
| 2024 | $36 | $94,300 | $0 | $0 |
| 2023 | $3,476 | $83,300 | $0 | $0 |
| 2022 | $3,388 | $70,400 | $0 | $0 |
| 2021 | $3,323 | $67,000 | $0 | $0 |
| 2020 | $3,211 | $58,000 | $0 | $0 |
| 2019 | $3,044 | $52,800 | $0 | $0 |
| 2018 | $3,950 | $49,400 | $0 | $0 |
| 2017 | $3,361 | $45,245 | $11,745 | $33,500 |
| 2016 | $3,044 | $45,229 | $0 | $0 |
| 2015 | -- | $53,609 | $0 | $0 |
| 2013 | $2,058 | $47,523 | $0 | $0 |
| 2011 | -- | $52,952 | $12,549 | $40,403 |
Source: Public Records
Map
Nearby Homes
- 33420 Utica Rd
- 0 14 Mile Rd
- 33526 Duncan
- 16572 Rosemary
- 33710 Mulvey
- 16970 Park Ln
- 33515 Vista Way
- 34150 Garfield Cir Unit W3
- 17485 Hans Dr
- 34690 Clarkson Dr W Unit 27
- 31611 Fraser Dr Unit 6
- 34650 Clarkson Dr W Unit 43
- 16160 Clarkson Dr
- 16143 Clarkson Dr Unit 2
- 17689 Masonic
- 31869 Grove
- 32863 Beacon Ln
- 32653 Beacon Ln
- 34376 Giannetti Dr
- 17325 Doris