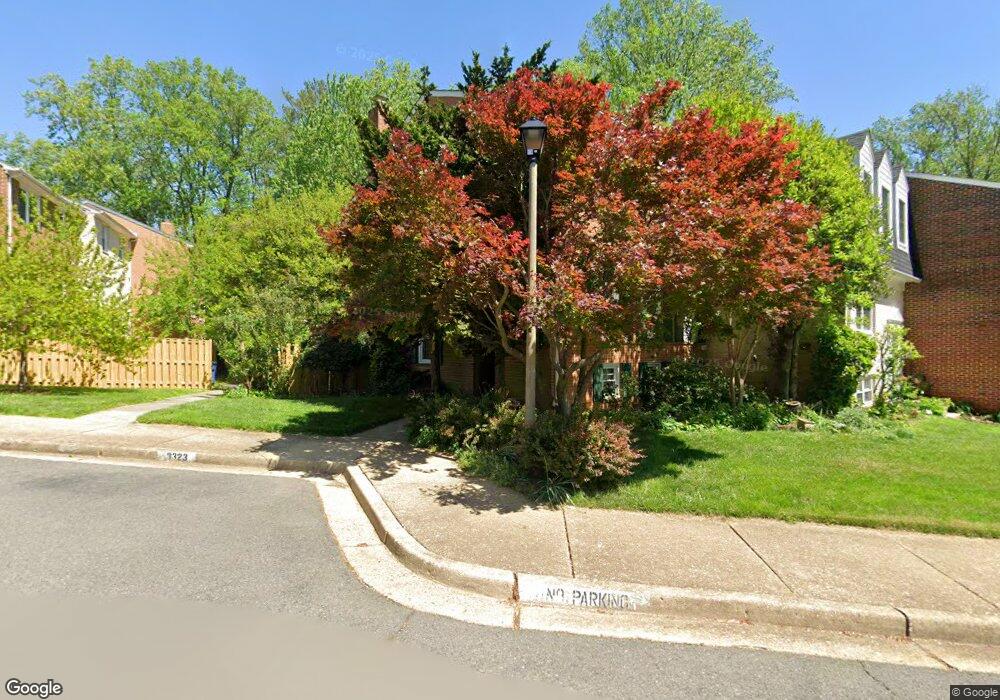
3323 Contessa Ct Annandale, VA 22003
Estimated Value: $559,000 - $645,000
3
Beds
4
Baths
1,518
Sq Ft
$400/Sq Ft
Est. Value
About This Home
This home is located at 3323 Contessa Ct, Annandale, VA 22003 and is currently estimated at $606,506, approximately $399 per square foot. 3323 Contessa Ct is a home located in Fairfax County with nearby schools including Camelot Elementary School, Luther Jackson Middle School, and Falls Church High School.
Ownership History
Date
Name
Owned For
Owner Type
Purchase Details
Closed on
Oct 16, 2025
Sold by
Evert Richard S
Bought by
Richard S Evert Revocable Trust and Evert
Current Estimated Value
Purchase Details
Closed on
Feb 20, 1997
Sold by
Pope + Neta M
Bought by
Evert Richard S
Purchase Details
Closed on
Jul 26, 1996
Sold by
Dunphy Martin A
Bought by
Evert Richard S
Home Financials for this Owner
Home Financials are based on the most recent Mortgage that was taken out on this home.
Original Mortgage
$137,600
Interest Rate
8.37%
Purchase Details
Closed on
Sep 16, 1993
Sold by
Swann L J
Bought by
Dunphy Martin A
Home Financials for this Owner
Home Financials are based on the most recent Mortgage that was taken out on this home.
Original Mortgage
$163,400
Interest Rate
7.16%
Create a Home Valuation Report for This Property
The Home Valuation Report is an in-depth analysis detailing your home's value as well as a comparison with similar homes in the area
Home Values in the Area
Average Home Value in this Area
Purchase History
| Date | Buyer | Sale Price | Title Company |
|---|---|---|---|
| Richard S Evert Revocable Trust | -- | None Listed On Document | |
| Evert Richard S | -- | -- | |
| Evert Richard S | $172,000 | -- | |
| Dunphy Martin A | $172,000 | -- |
Source: Public Records
Mortgage History
| Date | Status | Borrower | Loan Amount |
|---|---|---|---|
| Previous Owner | Dunphy Martin A | $137,600 | |
| Previous Owner | Dunphy Martin A | $163,400 | |
| Closed | Dunphy Martin A | $17,200 |
Source: Public Records
Tax History Compared to Growth
Tax History
| Year | Tax Paid | Tax Assessment Tax Assessment Total Assessment is a certain percentage of the fair market value that is determined by local assessors to be the total taxable value of land and additions on the property. | Land | Improvement |
|---|---|---|---|---|
| 2025 | $6,592 | $606,290 | $185,000 | $421,290 |
| 2024 | $6,592 | $569,010 | $170,000 | $399,010 |
| 2023 | $6,140 | $544,060 | $160,000 | $384,060 |
| 2022 | $5,951 | $520,440 | $150,000 | $370,440 |
| 2021 | $5,554 | $473,320 | $140,000 | $333,320 |
| 2020 | $5,433 | $459,030 | $140,000 | $319,030 |
| 2019 | $5,306 | $448,310 | $135,000 | $313,310 |
| 2018 | $4,681 | $407,040 | $122,000 | $285,040 |
| 2017 | $4,726 | $407,040 | $122,000 | $285,040 |
| 2016 | $4,628 | $399,450 | $120,000 | $279,450 |
| 2015 | $4,311 | $386,310 | $115,000 | $271,310 |
| 2014 | $4,049 | $363,610 | $111,000 | $252,610 |
Source: Public Records
Map
Nearby Homes
- 3322 Woodburn Village Dr Unit 13
- 3314 Woodburn Village Dr Unit 13
- 8316 Tobin Rd Unit 8316-11
- 3331 Webley Ct
- 8302 Tobin Rd Unit 11
- 3371 Breckenridge Ct
- 8300 Tobin Rd Unit 34
- 8300 Tobin Rd Unit 23
- 3134 Prosperity Ave
- 8105 Gale St
- 3436 Holly Rd
- 7822 Holmes Run Dr
- 8803 Lynnhurst Dr
- 7814 Wendy Ridge Ln
- 8065 Nicosh Circle Ln Unit 55
- 8085 Gatehouse Rd Unit 4
- 8058 Genea Way Unit 48
- 3003 Nicosh Cir Unit 3106
- 8908 Lynnhurst Dr
- 3021 Nicosh Cir Unit 1108
- 3325 Contessa Ct
- 3327 Contessa Ct
- 3329 Contessa Ct
- 8355 Thompson Rd
- 3331 Contessa Ct
- 8353 Thompson Rd
- 3320 Contessa Ct
- 8351 Thompson Rd
- 3333 Contessa Ct
- 3322 Contessa Ct
- 8357 Thompson Rd
- 3324 Contessa Ct
- 3335 Contessa Ct
- 8359 Thompson Rd
- 3326 Contessa Ct
- 3328 Contessa Ct
- 8361 Thompson Rd
- 3330 Contessa Ct
- 3337 Contessa Ct
- 3339 Contessa Ct