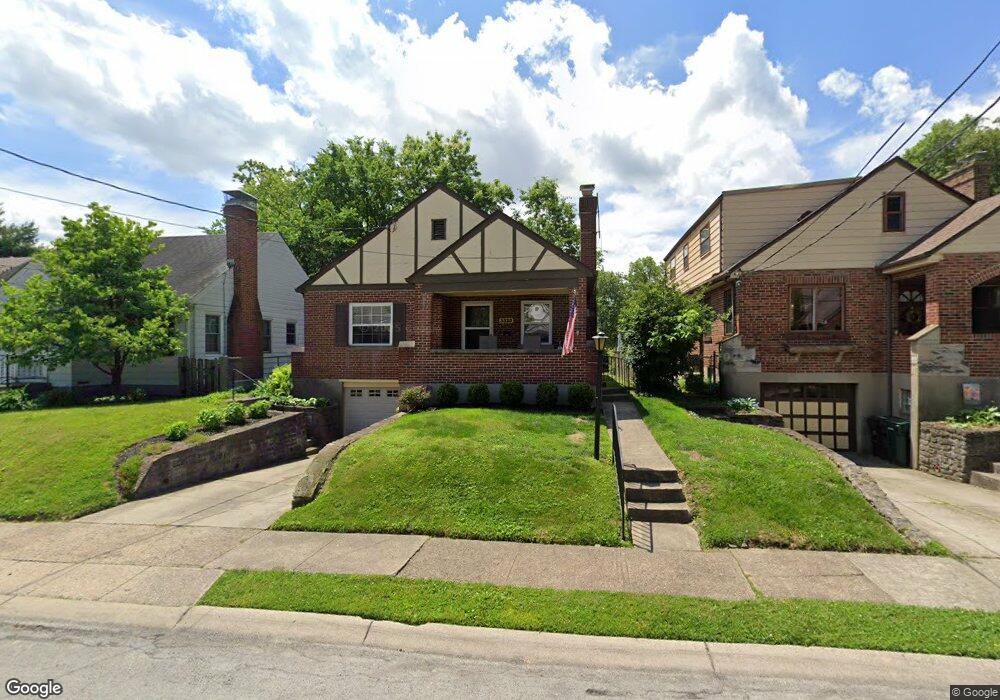
3323 Maplecrest Place Cincinnati, OH 45209
Oakley NeighborhoodEstimated Value: $317,958 - $393,000
2
Beds
1
Bath
1,224
Sq Ft
$289/Sq Ft
Est. Value
About This Home
This home is located at 3323 Maplecrest Place, Cincinnati, OH 45209 and is currently estimated at $353,740, approximately $289 per square foot. 3323 Maplecrest Place is a home located in Hamilton County with nearby schools including Kilgour Elementary School, Clark Montessori High School, and Shroder High School.
Ownership History
Date
Name
Owned For
Owner Type
Purchase Details
Closed on
Dec 3, 2004
Sold by
Grissom Georgina A
Bought by
Uhl John M
Current Estimated Value
Home Financials for this Owner
Home Financials are based on the most recent Mortgage that was taken out on this home.
Original Mortgage
$148,700
Outstanding Balance
$66,306
Interest Rate
4.5%
Mortgage Type
Fannie Mae Freddie Mac
Estimated Equity
$287,434
Create a Home Valuation Report for This Property
The Home Valuation Report is an in-depth analysis detailing your home's value as well as a comparison with similar homes in the area
Home Values in the Area
Average Home Value in this Area
Purchase History
| Date | Buyer | Sale Price | Title Company |
|---|---|---|---|
| Uhl John M | $175,000 | Advanced Land Title Agency L |
Source: Public Records
Mortgage History
| Date | Status | Borrower | Loan Amount |
|---|---|---|---|
| Open | Uhl John M | $148,700 |
Source: Public Records
Tax History
| Year | Tax Paid | Tax Assessment Tax Assessment Total Assessment is a certain percentage of the fair market value that is determined by local assessors to be the total taxable value of land and additions on the property. | Land | Improvement |
|---|---|---|---|---|
| 2025 | $4,953 | $80,385 | $37,079 | $43,306 |
| 2023 | $4,911 | $80,385 | $37,079 | $43,306 |
| 2022 | $5,571 | $81,827 | $34,097 | $47,730 |
| 2021 | $5,362 | $81,827 | $34,097 | $47,730 |
| 2020 | $5,519 | $81,827 | $34,097 | $47,730 |
| 2019 | $5,245 | $71,152 | $29,649 | $41,503 |
| 2018 | $5,253 | $71,152 | $29,649 | $41,503 |
| 2017 | $4,991 | $71,152 | $29,649 | $41,503 |
| 2016 | $4,409 | $61,961 | $24,497 | $37,464 |
| 2015 | $3,975 | $61,961 | $24,497 | $37,464 |
| 2014 | $4,003 | $61,961 | $24,497 | $37,464 |
| 2013 | $3,737 | $56,844 | $22,474 | $34,370 |
Source: Public Records
Map
Nearby Homes
- 3319 De Forest Dr
- 3327 De Forest Dr
- 3334 De Forest Dr
- 4422 Canyon Oak Ct
- 4418 Canyon Oak Ct
- 2947 Iron Oak Ln
- 3649 Herschel Ave
- 3613 Herschel Ave
- 3517 Tarpis Ave
- 3917 Paxton Ave
- 3259 Berwyn Place
- 3764 Mount Vernon Ave
- 3439 Pape Ave
- 4123 Marburg Ave
- 3525 Herschel View Place
- 3311 Bach Ave
- 3309 Bach Ave
- 3831 Mount Vernon Ave
- 3744 Isabella Ave
- 4121 Ballard Ave
- 3319 Maplecrest Place
- 3327 Maplecrest Place
- 3331 Maplecrest Place
- 3315 Maplecrest Place
- 3322 De Forest Dr
- 3318 De Forest Dr
- 3326 De Forest Dr
- 3314 De Forest Dr
- 3330 De Forest Dr
- 3335 Maplecrest Place
- 3311 Maplecrest Place
- 3322 Maplecrest Place
- 3326 Maplecrest Place
- 3318 Maplecrest Place
- 3310 De Forest Dr
- 3314 Maplecrest Place
- 3307 Maplecrest Place
- 3339 Maplecrest Place
- 3310 Maplecrest Place
- 3306 De Forest Dr
Your Personal Tour Guide
Ask me questions while you tour the home.