Estimated Value: $422,000 - $457,496
5
Beds
3
Baths
2,110
Sq Ft
$209/Sq Ft
Est. Value
About This Home
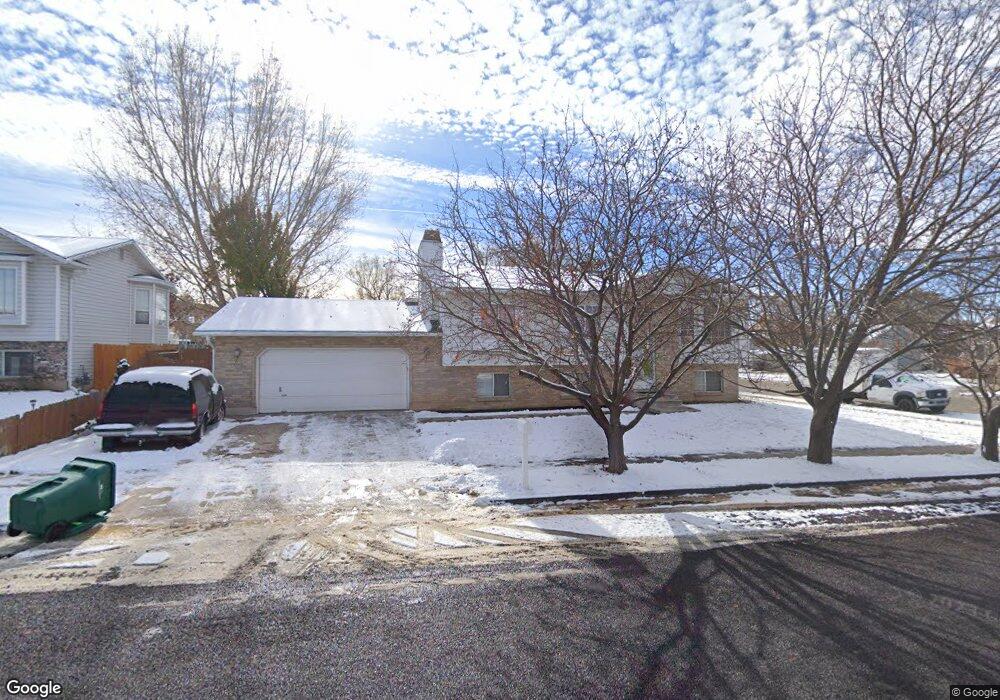
This home is located at 3323 W 4975 S, Roy, UT 84067 and is currently estimated at $441,124, approximately $209 per square foot. 3323 W 4975 S is a home located in Weber County with nearby schools including Midland School, Sand Ridge Junior High School, and Roy High School.
Ownership History
Date
Name
Owned For
Owner Type
Purchase Details
Closed on
Sep 7, 2018
Sold by
Mendoza Maria Leon and Rodriguez Nicolas Estrada
Bought by
Estrada Danny and Canchola Ariana J
Current Estimated Value
Home Financials for this Owner
Home Financials are based on the most recent Mortgage that was taken out on this home.
Original Mortgage
$216,000
Outstanding Balance
$187,977
Interest Rate
4.5%
Mortgage Type
New Conventional
Estimated Equity
$253,147
Purchase Details
Closed on
Jul 16, 2002
Sold by
Mendoza Maria Leon
Bought by
Rodriguez Nicolas Estrada and Mendoza Maria Leon
Purchase Details
Closed on
Feb 27, 1997
Sold by
Gailey Brian R and Gailey Dianne W
Bought by
Brown Stephen P and Suzanne Brown C
Home Financials for this Owner
Home Financials are based on the most recent Mortgage that was taken out on this home.
Original Mortgage
$112,575
Interest Rate
7.86%
Create a Home Valuation Report for This Property
The Home Valuation Report is an in-depth analysis detailing your home's value as well as a comparison with similar homes in the area
Home Values in the Area
Average Home Value in this Area
Purchase History
| Date | Buyer | Sale Price | Title Company |
|---|---|---|---|
| Estrada Danny | -- | Mountain View Title | |
| Rodriguez Nicolas Estrada | -- | Bonneville Title | |
| Mendoza Maria Leon | -- | Bonneville Title | |
| Brown Stephen P | -- | Associated Title |
Source: Public Records
Mortgage History
| Date | Status | Borrower | Loan Amount |
|---|---|---|---|
| Open | Estrada Danny | $216,000 | |
| Previous Owner | Brown Stephen P | $112,575 |
Source: Public Records
Tax History
| Year | Tax Paid | Tax Assessment Tax Assessment Total Assessment is a certain percentage of the fair market value that is determined by local assessors to be the total taxable value of land and additions on the property. | Land | Improvement |
|---|---|---|---|---|
| 2025 | $2,786 | $444,635 | $131,089 | $313,546 |
| 2024 | $2,718 | $240,349 | $72,105 | $168,244 |
| 2023 | $2,503 | $220,550 | $64,894 | $155,656 |
| 2022 | $2,716 | $248,050 | $59,551 | $188,499 |
| 2021 | $2,119 | $316,000 | $78,213 | $237,787 |
| 2020 | $2,040 | $280,000 | $78,213 | $201,787 |
| 2019 | $2,016 | $261,000 | $43,596 | $217,404 |
| 2018 | $1,929 | $235,000 | $38,660 | $196,340 |
| 2017 | $1,698 | $192,000 | $38,660 | $153,340 |
| 2016 | $1,659 | $101,010 | $21,415 | $79,595 |
| 2015 | $1,479 | $91,581 | $21,415 | $70,166 |
| 2014 | $1,485 | $91,036 | $21,415 | $69,621 |
Source: Public Records
Map
Nearby Homes
- 5155 S 3200 W
- 3509 W 4835 S Unit 26
- 3443 W 5200 S Unit 2&3
- 3517 W 4835 S Unit 27
- 5321 S 3100 W
- 5141 S 2975 W
- 4793 S 3025 W
- 5009 S 2925 W
- 5304 S 3100 W
- 3022 W 4750 S
- 4891 S 2875 W
- 5063 S 2825 W
- 3405 W 4525 S
- 4510 Stone Creek Rd Unit F
- 2817 W 5000 S
- 4491 Haven Creek Rd Unit A
- 5529 S 3200 W
- 2953 W 4650 S
- 4813 S 3850 W
- 4950 3900 West St
Your Personal Tour Guide
Ask me questions while you tour the home.