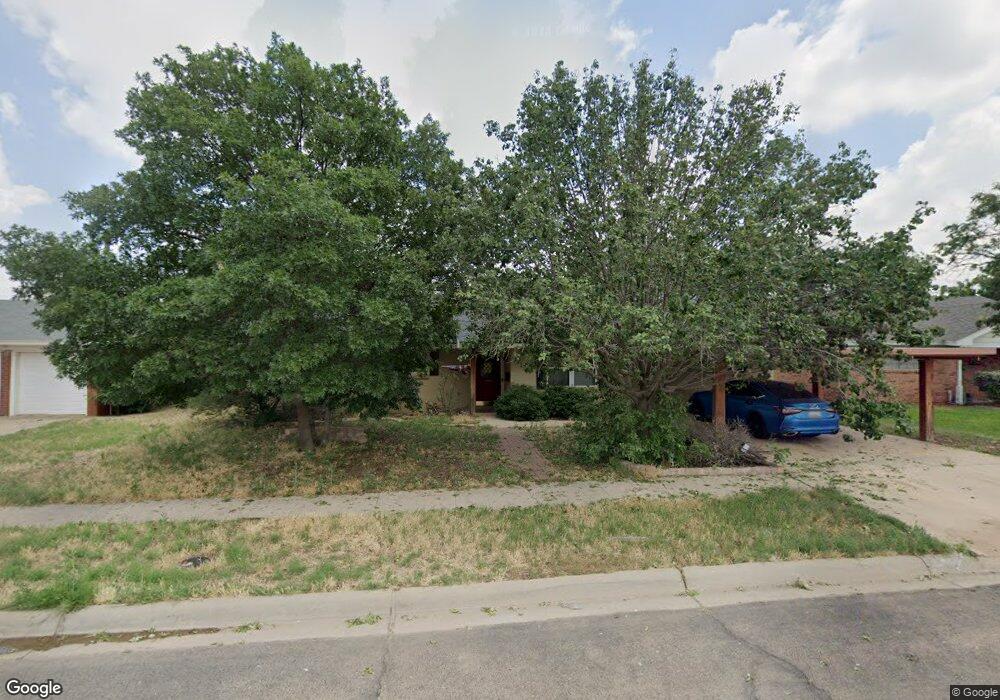
3323 W Dengar Ave Midland, TX 79707
Hyde Park NeighborhoodEstimated Value: $321,000 - $380,174
--
Bed
--
Bath
1,905
Sq Ft
$181/Sq Ft
Est. Value
About This Home
This home is located at 3323 W Dengar Ave, Midland, TX 79707 and is currently estimated at $344,544, approximately $180 per square foot. 3323 W Dengar Ave is a home located in Midland County with nearby schools including Rusk Elementary School, Alamo Junior High School, and Trinity School of Midland.
Ownership History
Date
Name
Owned For
Owner Type
Purchase Details
Closed on
Feb 24, 2017
Sold by
Sanchez Benito
Bought by
Nguyen Tuong
Current Estimated Value
Purchase Details
Closed on
Aug 30, 2012
Sold by
Vest Cecil and Vest Francis
Bought by
Sanchez Benito and Sancehz Laura
Home Financials for this Owner
Home Financials are based on the most recent Mortgage that was taken out on this home.
Original Mortgage
$190,486
Interest Rate
3.56%
Mortgage Type
FHA
Purchase Details
Closed on
Oct 9, 2009
Sold by
Vest Steven and Vest Christine
Bought by
Vest Cecil and Vest Francis
Purchase Details
Closed on
Jul 16, 2007
Sold by
Carter Bruce and Morrison Jeannie
Bought by
Vest Steven R and Vest Christine H
Home Financials for this Owner
Home Financials are based on the most recent Mortgage that was taken out on this home.
Original Mortgage
$40,500
Interest Rate
6.54%
Mortgage Type
Purchase Money Mortgage
Purchase Details
Closed on
Jan 29, 1964
Bought by
Nguyen Tuong
Create a Home Valuation Report for This Property
The Home Valuation Report is an in-depth analysis detailing your home's value as well as a comparison with similar homes in the area
Home Values in the Area
Average Home Value in this Area
Purchase History
| Date | Buyer | Sale Price | Title Company |
|---|---|---|---|
| Nguyen Tuong | -- | -- | |
| Sanchez Benito | -- | None Available | |
| Vest Cecil | -- | None Available | |
| Vest Steven R | -- | Lone Star Abstract & Title C | |
| Nguyen Tuong | -- | -- |
Source: Public Records
Mortgage History
| Date | Status | Borrower | Loan Amount |
|---|---|---|---|
| Previous Owner | Sanchez Benito | $190,486 | |
| Previous Owner | Vest Steven R | $40,500 |
Source: Public Records
Tax History Compared to Growth
Tax History
| Year | Tax Paid | Tax Assessment Tax Assessment Total Assessment is a certain percentage of the fair market value that is determined by local assessors to be the total taxable value of land and additions on the property. | Land | Improvement |
|---|---|---|---|---|
| 2025 | $5,518 | $440,780 | $16,380 | $424,400 |
| 2024 | $5,527 | $448,780 | $16,380 | $432,400 |
| 2023 | $6,408 | $434,180 | $16,380 | $417,800 |
| 2022 | $6,073 | $388,720 | $16,380 | $372,340 |
| 2021 | $6,599 | $388,720 | $16,380 | $372,340 |
| 2020 | $5,252 | $369,980 | $16,380 | $353,600 |
| 2019 | $5,926 | $313,030 | $16,380 | $353,600 |
| 2018 | $5,533 | $284,570 | $16,380 | $268,190 |
| 2017 | $5,209 | $267,920 | $16,380 | $251,540 |
| 2016 | $4,278 | $219,600 | $16,380 | $208,330 |
| 2015 | -- | $199,630 | $16,380 | $189,470 |
| 2014 | -- | $197,800 | $0 | $0 |
Source: Public Records
Map
Nearby Homes
- 3316 W Dengar Ave
- 3308 W Dengar Ave
- 3311 Terrace Ave
- 3235 W Shandon Ave
- 3231 W Dengar Ave
- 3227 W Dengar Ave
- 2106 Rosita Dr
- 3210 Cimmaron Ave
- 3517 Seaboard Ave
- 3302 Windsor Dr
- 3303 Windsor Dr
- 3323 Maxwell Dr
- 2824 Cimmaron Ave
- 3101 Stanolind Ave
- 3200 Whitney Dr
- 3204 Shell Ave
- 3204 W Wadley Ave
- 3322 Providence Dr
- 3400 Salisbury Place
- 3200 W Wadley Ave
- 3325 W Dengar Ave
- 3321 W Dengar Ave
- 3320 Cimmaron Ave
- 3322 Cimmaron Ave
- 3318 Cimmaron Ave
- 3319 W Dengar Ave
- 3324 W Dengar Ave
- 3327 W Dengar Ave
- 3326 W Dengar Ave
- 3322 W Dengar Ave
- 3324 Cimmaron Ave
- 3316 Cimmaron Ave
- 3328 W Dengar Ave
- 3320 W Dengar Ave
- 3317 W Dengar Ave
- 3326 Cimmaron Ave
- 3314 Cimmaron Ave
- 3329 W Dengar Ave
- 3318 W Dengar Ave
- 3330 W Dengar Ave