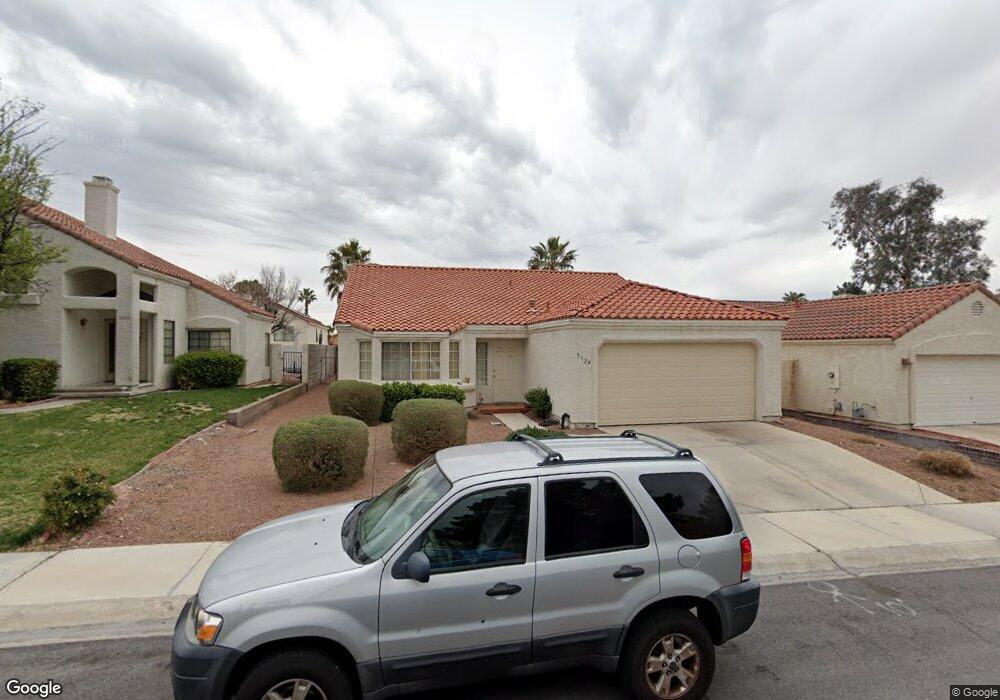
3324 Beach Port Dr Las Vegas, NV 89117
The Section Seven NeighborhoodEstimated Value: $454,640 - $474,000
2
Beds
2
Baths
1,608
Sq Ft
$288/Sq Ft
Est. Value
About This Home
This home is located at 3324 Beach Port Dr, Las Vegas, NV 89117 and is currently estimated at $463,660, approximately $288 per square foot. 3324 Beach Port Dr is a home located in Clark County with nearby schools including M J Christensen Elementary School, Clifford J Lawrence Junior High School, and Bonanza High School.
Ownership History
Date
Name
Owned For
Owner Type
Purchase Details
Closed on
May 1, 2021
Sold by
Leung Barbara
Bought by
Barbara Leung Family Trust and Leung
Current Estimated Value
Purchase Details
Closed on
Mar 22, 2005
Sold by
Vockrodt John A and Vockrodt Katherine E
Bought by
Leung Barbara
Home Financials for this Owner
Home Financials are based on the most recent Mortgage that was taken out on this home.
Original Mortgage
$244,000
Interest Rate
5.5%
Mortgage Type
Unknown
Purchase Details
Closed on
Mar 16, 2005
Sold by
Leung Eric
Bought by
Leung Barbara
Home Financials for this Owner
Home Financials are based on the most recent Mortgage that was taken out on this home.
Original Mortgage
$244,000
Interest Rate
5.5%
Mortgage Type
Unknown
Purchase Details
Closed on
Mar 26, 1997
Sold by
Tise Jorge
Bought by
Vockrodt John A and Vockrodt Katherine E
Home Financials for this Owner
Home Financials are based on the most recent Mortgage that was taken out on this home.
Original Mortgage
$89,600
Interest Rate
8.13%
Create a Home Valuation Report for This Property
The Home Valuation Report is an in-depth analysis detailing your home's value as well as a comparison with similar homes in the area
Home Values in the Area
Average Home Value in this Area
Purchase History
| Date | Buyer | Sale Price | Title Company |
|---|---|---|---|
| Barbara Leung Family Trust | -- | None Listed On Document | |
| Leung Barbara | $305,000 | Fidelity National Title | |
| Leung Barbara | -- | Fidelity National Title | |
| Vockrodt John A | $128,000 | Old Republic Title Company |
Source: Public Records
Mortgage History
| Date | Status | Borrower | Loan Amount |
|---|---|---|---|
| Previous Owner | Leung Barbara | $244,000 | |
| Previous Owner | Vockrodt John A | $89,600 | |
| Closed | Leung Barbara | $30,000 |
Source: Public Records
Tax History Compared to Growth
Tax History
| Year | Tax Paid | Tax Assessment Tax Assessment Total Assessment is a certain percentage of the fair market value that is determined by local assessors to be the total taxable value of land and additions on the property. | Land | Improvement |
|---|---|---|---|---|
| 2025 | $2,456 | $92,743 | $43,750 | $48,993 |
| 2024 | $2,275 | $92,743 | $43,750 | $48,993 |
| 2023 | $2,275 | $83,038 | $35,700 | $47,338 |
| 2022 | $1,532 | $76,277 | $32,550 | $43,727 |
| 2021 | $1,951 | $69,838 | $28,000 | $41,838 |
| 2020 | $1,809 | $67,766 | $25,900 | $41,866 |
| 2019 | $1,695 | $64,878 | $23,450 | $41,428 |
| 2018 | $1,617 | $62,361 | $22,050 | $40,311 |
| 2017 | $2,072 | $63,191 | $22,050 | $41,141 |
| 2016 | $1,532 | $57,825 | $15,750 | $42,075 |
| 2015 | $1,528 | $47,432 | $11,550 | $35,882 |
| 2014 | $1,481 | $43,823 | $8,750 | $35,073 |
Source: Public Records
Map
Nearby Homes
- 3324 Canyon Lake Dr
- 9333 Dry Dock Dr
- 9305 Alameda Harbor Ave
- 9405 Crosspointe Ave
- 3220 Crescent Run Ct Unit 1
- 3340 Shallow Pond Dr
- 3220 Ventana Hills Dr
- 3204 Crescent Run Ct
- 3205 Bermuda Bay St
- 3320 S Fort Apache Rd Unit 239
- 3320 S Fort Apache Rd Unit 218
- 3320 S Fort Apache Rd Unit 132
- 9312 Angelfish Dr
- 9105 Cypress Point Way
- 9116 Cypress Point Way
- 9514 Teton Vista Ave
- 9028 Cypress Point Way
- 9013 Cypress Point Way
- 9506 Teton Diablo Ave
- 3320 Haven Beach Way
- 3324 Beach Port Dr
- 3320 Beach Port Dr
- 3328 Beach Port Dr
- 3325 Agustine Cir
- 3316 Beach Port Dr Unit 2
- 3321 Agustine Cir
- 3329 Agustine Cir
- 3325 Beach Port Dr
- 3329 Beach Port Dr
- 3312 Beach Port Dr
- 3321 Beach Port Dr
- 3317 Agustine Cir
- 3310 Beach Port Dr
- 3333 Beach Port Dr
- 9329 Dry Dock Dr
- 3317 Beach Port Dr
- 9325 Dry Dock Dr
- 3308 Beach Port Dr
- 9337 Dry Dock Dr
- 9341 Dry Dock Dr