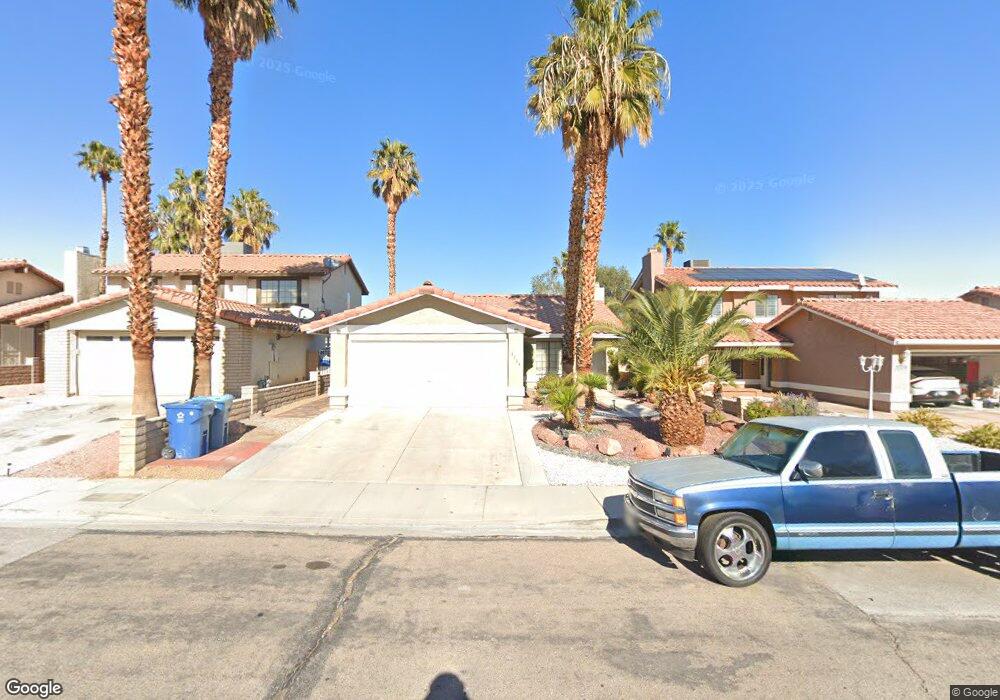
3324 Othello Dr Las Vegas, NV 89121
Estimated Value: $366,514 - $395,000
3
Beds
2
Baths
1,266
Sq Ft
$301/Sq Ft
Est. Value
About This Home
This home is located at 3324 Othello Dr, Las Vegas, NV 89121 and is currently estimated at $380,629, approximately $300 per square foot. 3324 Othello Dr is a home located in Clark County with nearby schools including Will Beckley Elementary School, Knudson Academy of the Arts, and Valley High School.
Ownership History
Date
Name
Owned For
Owner Type
Purchase Details
Closed on
Mar 17, 2022
Sold by
Ilene Martin
Bought by
Hill Bianca Ludwig
Current Estimated Value
Home Financials for this Owner
Home Financials are based on the most recent Mortgage that was taken out on this home.
Original Mortgage
$335,620
Outstanding Balance
$312,241
Interest Rate
3.55%
Mortgage Type
New Conventional
Estimated Equity
$68,388
Purchase Details
Closed on
Jan 29, 2003
Sold by
Corbally Jeffrey R
Bought by
Martin Ilene
Home Financials for this Owner
Home Financials are based on the most recent Mortgage that was taken out on this home.
Original Mortgage
$90,000
Interest Rate
5.97%
Purchase Details
Closed on
Aug 9, 1994
Sold by
Vowell Lisa M
Bought by
Corbally Jeffrey R
Home Financials for this Owner
Home Financials are based on the most recent Mortgage that was taken out on this home.
Original Mortgage
$102,761
Interest Rate
8.77%
Mortgage Type
FHA
Create a Home Valuation Report for This Property
The Home Valuation Report is an in-depth analysis detailing your home's value as well as a comparison with similar homes in the area
Home Values in the Area
Average Home Value in this Area
Purchase History
| Date | Buyer | Sale Price | Title Company |
|---|---|---|---|
| Hill Bianca Ludwig | $346,000 | Wfg National Title | |
| Martin Ilene | $135,900 | Pioneer National Title | |
| Corbally Jeffrey R | $104,000 | United Title |
Source: Public Records
Mortgage History
| Date | Status | Borrower | Loan Amount |
|---|---|---|---|
| Open | Hill Bianca Ludwig | $335,620 | |
| Previous Owner | Martin Ilene | $90,000 | |
| Previous Owner | Corbally Jeffrey R | $102,761 |
Source: Public Records
Tax History Compared to Growth
Tax History
| Year | Tax Paid | Tax Assessment Tax Assessment Total Assessment is a certain percentage of the fair market value that is determined by local assessors to be the total taxable value of land and additions on the property. | Land | Improvement |
|---|---|---|---|---|
| 2025 | $1,329 | $59,360 | $26,950 | $32,410 |
| 2024 | $1,231 | $59,360 | $26,950 | $32,410 |
| 2023 | $1,231 | $61,943 | $30,450 | $31,493 |
| 2022 | $1,140 | $53,018 | $23,800 | $29,218 |
| 2021 | $1,056 | $49,441 | $21,350 | $28,091 |
| 2020 | $1,022 | $48,863 | $20,650 | $28,213 |
| 2019 | $975 | $44,211 | $16,100 | $28,111 |
| 2018 | $930 | $42,769 | $15,400 | $27,369 |
| 2017 | $882 | $41,651 | $13,650 | $28,001 |
| 2016 | $882 | $38,910 | $11,200 | $27,710 |
| 2015 | $881 | $32,075 | $8,750 | $23,325 |
| 2014 | $853 | $29,123 | $7,000 | $22,123 |
Source: Public Records
Map
Nearby Homes
- 3295 Algona Cir
- 3122 Spokane Dr
- 3378 Del Marino St
- 3019 Tumwater St
- 3410 Pecos Way
- 3078 Kennewick Dr
- 3008 Kennewick Dr
- 3428 Don Miguel Dr
- 3078 S Pecos Rd
- 3435 Don Miguel Dr
- 3352 Bridgeport Dr
- 3642 Boulder Hwy Unit 342
- 3642 Boulder Hwy Unit 229
- 3642 Boulder Hwy Unit 154
- 3642 Boulder Hwy Unit 87
- 3642 Boulder Hwy Unit 312
- 3642 Boulder Hwy Unit 18-A
- 3642 Boulder Hwy Unit 177
- 3642 Boulder Hwy Unit 159
- 3642 Boulder Hwy Unit 94
- 3332 Othello Dr
- 3316 Othello Dr
- 3340 Othello Dr
- 3308 Othello Dr
- 3323 Astoria Dr
- 3315 Astoria Dr
- 3331 Astoria Dr
- 3307 Astoria Dr
- 3348 Othello Dr
- 3300 Othello Dr
- 3339 Astoria Dr
- 3325 Othello Dr Unit 2
- 3333 Othello Dr
- 3317 Othello Dr
- 3299 Astoria Dr Unit 1
- 3341 Othello Dr Unit 1007
- 3347 Astoria Dr
- 3356 Othello Dr
- 3309 Othello Dr
- 3292 Othello Dr