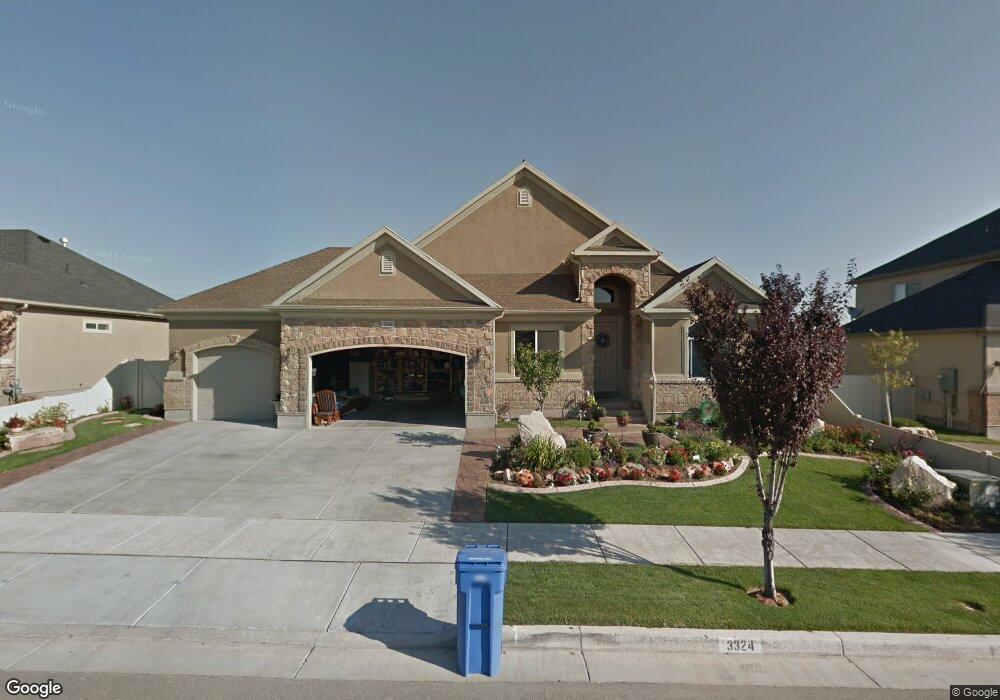
3324 W Chatel Dr Riverton, UT 84065
Estimated Value: $741,000 - $833,000
5
Beds
4
Baths
4,098
Sq Ft
$190/Sq Ft
Est. Value
About This Home
This home is located at 3324 W Chatel Dr, Riverton, UT 84065 and is currently estimated at $776,598, approximately $189 per square foot. 3324 W Chatel Dr is a home located in Salt Lake County with nearby schools including Rose Creek School, Oquirrh Hills Middle School, and Riverton High School.
Ownership History
Date
Name
Owned For
Owner Type
Purchase Details
Closed on
Jun 28, 2017
Sold by
Havgerty James W
Bought by
Souza Jailson D De and Souza Liliana B De
Current Estimated Value
Home Financials for this Owner
Home Financials are based on the most recent Mortgage that was taken out on this home.
Original Mortgage
$372,000
Outstanding Balance
$310,168
Interest Rate
4.02%
Mortgage Type
New Conventional
Estimated Equity
$466,430
Purchase Details
Closed on
Dec 12, 2016
Sold by
Hegerty James
Bought by
Hagerty James W
Home Financials for this Owner
Home Financials are based on the most recent Mortgage that was taken out on this home.
Original Mortgage
$417,000
Interest Rate
3.54%
Mortgage Type
VA
Purchase Details
Closed on
Sep 18, 2009
Sold by
D R Horton Inc
Bought by
Murphy Shawn J and Murphy Angela D
Home Financials for this Owner
Home Financials are based on the most recent Mortgage that was taken out on this home.
Original Mortgage
$304,000
Interest Rate
5.18%
Mortgage Type
New Conventional
Create a Home Valuation Report for This Property
The Home Valuation Report is an in-depth analysis detailing your home's value as well as a comparison with similar homes in the area
Home Values in the Area
Average Home Value in this Area
Purchase History
| Date | Buyer | Sale Price | Title Company |
|---|---|---|---|
| Souza Jailson D De | -- | Northern Title Co | |
| Hagerty James W | -- | Northwest Title Agency | |
| Murphy Shawn J | -- | Highland Title Agency |
Source: Public Records
Mortgage History
| Date | Status | Borrower | Loan Amount |
|---|---|---|---|
| Open | Souza Jailson D De | $372,000 | |
| Previous Owner | Hagerty James W | $417,000 | |
| Previous Owner | Murphy Shawn J | $304,000 |
Source: Public Records
Tax History
| Year | Tax Paid | Tax Assessment Tax Assessment Total Assessment is a certain percentage of the fair market value that is determined by local assessors to be the total taxable value of land and additions on the property. | Land | Improvement |
|---|---|---|---|---|
| 2025 | $4,084 | $736,200 | $198,000 | $538,200 |
| 2024 | $4,084 | $706,900 | $189,600 | $517,300 |
| 2023 | $4,134 | $674,600 | $185,900 | $488,700 |
| 2022 | $4,180 | $669,100 | $182,200 | $486,900 |
| 2021 | $3,516 | $501,100 | $145,800 | $355,300 |
| 2020 | $3,479 | $462,300 | $145,800 | $316,500 |
| 2019 | $3,495 | $456,600 | $117,500 | $339,100 |
| 2016 | $2,099 | $390,600 | $114,800 | $275,800 |
Source: Public Records
Map
Nearby Homes
- 13529 Chamonix Way
- 13638 S 3160 W
- 3277 W 13120 S
- 13691 S 3160 W
- 13883 S Oxfordshire Dr
- 12906 Verona Creek Way
- 13849 S Wasatch Vista Dr
- 12872 S 3600 W
- 3702 W Wasatch Vista Dr
- 13933 S White Tail Cove
- 12753 S Gilbert Dr
- 3232 Jayden Mae Dr
- 14253 S Jemma Dr
- 2384 W Frontier St
- 2379 W 13100 S
- 4177 W 13400 S
- 4191 W 13400 S
- 12495 S 3240 W
- 14371 S Jayden Mae Dr Unit 21
- 2141 W 13180 S
- 3324 Chatel Dr
- 3314 Chatel Dr
- 3332 W Chatel Dr
- 3332 Chatel Dr
- 3314 W Chatel Dr
- 3313 Chatel Dr
- 3317 Chatel Dr
- 3317 W Chatel Dr
- 3344 Chatel Dr
- 3344 W Chatel Dr
- 3327 Chatel Dr
- 3327 W Chatel Dr
- 3313 W Chatel Dr
- 13419 Chamonix Way
- 3339 Chatel Dr
- 3339 W Chatel Dr Unit 128
- 3339 W Chatel Dr
- 3354 W Chatel Dr
- 3353 W 13370 S
- 3354 Chatel Dr
Your Personal Tour Guide
Ask me questions while you tour the home.