Estimated Value: $515,000 - $670,787
5
Beds
4
Baths
2,129
Sq Ft
$284/Sq Ft
Est. Value
About This Home
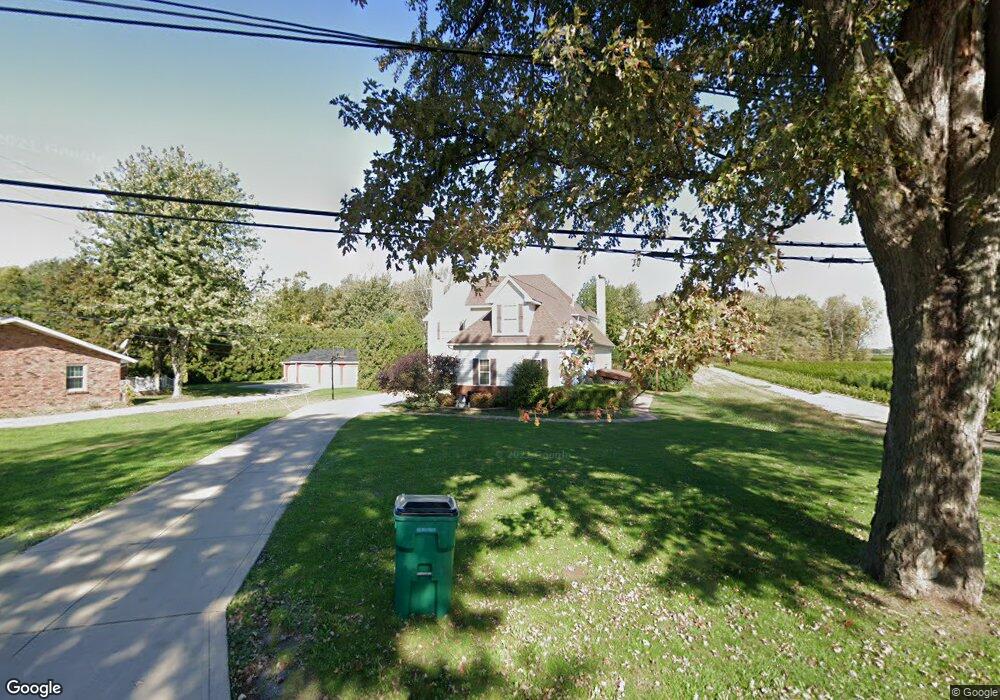
This home is located at 3325 Narrows Rd, Perry, OH 44081 and is currently estimated at $604,947, approximately $284 per square foot. 3325 Narrows Rd is a home located in Lake County with nearby schools including Perry Elementary School, Perry Middle School, and Perry High School.
Ownership History
Date
Name
Owned For
Owner Type
Purchase Details
Closed on
Jun 8, 2004
Sold by
B R Knez Construction Inc
Bought by
Wills John M and Wills Gayle E
Current Estimated Value
Home Financials for this Owner
Home Financials are based on the most recent Mortgage that was taken out on this home.
Original Mortgage
$250,000
Outstanding Balance
$122,701
Interest Rate
6.06%
Mortgage Type
Purchase Money Mortgage
Estimated Equity
$482,246
Purchase Details
Closed on
Mar 1, 2004
Sold by
Wills John M and Wills Gayle E
Bought by
B R Knez Construction Inc
Home Financials for this Owner
Home Financials are based on the most recent Mortgage that was taken out on this home.
Original Mortgage
$253,700
Interest Rate
5.71%
Mortgage Type
Purchase Money Mortgage
Purchase Details
Closed on
Aug 27, 2003
Sold by
Grof William D and Grof Josephine L
Bought by
Wills John M and Wills Gayle E
Create a Home Valuation Report for This Property
The Home Valuation Report is an in-depth analysis detailing your home's value as well as a comparison with similar homes in the area
Home Values in the Area
Average Home Value in this Area
Purchase History
| Date | Buyer | Sale Price | Title Company |
|---|---|---|---|
| Wills John M | $367,200 | Chicago Title Insurance Co | |
| B R Knez Construction Inc | -- | -- | |
| Wills John M | $45,000 | Enterprise Title |
Source: Public Records
Mortgage History
| Date | Status | Borrower | Loan Amount |
|---|---|---|---|
| Open | Wills John M | $250,000 | |
| Closed | B R Knez Construction Inc | $253,700 |
Source: Public Records
Tax History Compared to Growth
Tax History
| Year | Tax Paid | Tax Assessment Tax Assessment Total Assessment is a certain percentage of the fair market value that is determined by local assessors to be the total taxable value of land and additions on the property. | Land | Improvement |
|---|---|---|---|---|
| 2024 | -- | $228,800 | $30,420 | $198,380 |
| 2023 | $11,644 | $139,500 | $18,030 | $121,470 |
| 2022 | $6,323 | $139,500 | $18,030 | $121,470 |
| 2021 | $5,922 | $139,500 | $18,030 | $121,470 |
| 2020 | $5,463 | $116,240 | $15,020 | $101,220 |
| 2019 | $5,467 | $116,240 | $15,020 | $101,220 |
| 2018 | $5,446 | $109,090 | $15,830 | $93,260 |
| 2017 | $5,428 | $109,090 | $15,830 | $93,260 |
| 2016 | $5,395 | $109,090 | $15,830 | $93,260 |
| 2015 | $5,222 | $109,090 | $15,830 | $93,260 |
| 2014 | $5,124 | $109,090 | $15,830 | $93,260 |
| 2013 | $5,066 | $107,910 | $15,830 | $92,080 |
Source: Public Records
Map
Nearby Homes
- 3158 Narrows Rd
- 4300 Florida St
- 3147 Maine Ave
- 3781 Main St
- Aruba Bay Plan at Hidden Village
- Eden Cay Plan at Hidden Village
- Grand Bahama Plan at Hidden Village
- Grand Cayman Plan at Hidden Village
- 4292 Dogwood Ave
- 4404 Oak Ave
- 4371 Oak Ave
- 3811 Center Rd
- 4505 Lane Rd
- 4002 Main St
- 3982 Mallard Bay Unit 33
- 4401 Oak Ave
- V/L Tarpon Cove
- 108 Birch Dr
- 269 Hale Rd
- 4367 Main St