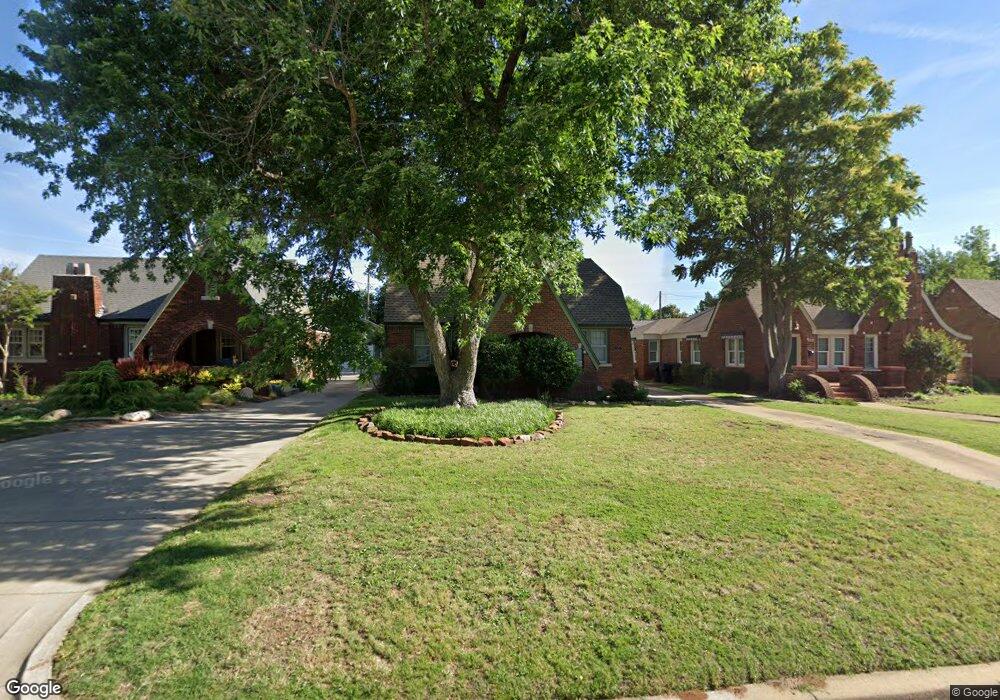
3325 NW 21st St Oklahoma City, OK 73107
Linwood Place NeighborhoodEstimated Value: $177,907 - $276,000
2
Beds
1
Bath
1,190
Sq Ft
$180/Sq Ft
Est. Value
About This Home
This home is located at 3325 NW 21st St, Oklahoma City, OK 73107 and is currently estimated at $214,477, approximately $180 per square foot. 3325 NW 21st St is a home located in Oklahoma County with nearby schools including Kaiser Elementary School, Taft Middle School, and Northwest Classen High School.
Ownership History
Date
Name
Owned For
Owner Type
Purchase Details
Closed on
Aug 29, 2025
Sold by
Owen James Michael and Owen Deborah G
Bought by
Owen Deborah G
Current Estimated Value
Purchase Details
Closed on
Dec 26, 2018
Sold by
Beauregard Deborah G and Owen Deborah G
Bought by
Owen James Michael and Owen Deborah G
Purchase Details
Closed on
Nov 30, 2005
Sold by
Carr Cynthia Kay and Carr Ron
Bought by
Beauregard Deborah G
Home Financials for this Owner
Home Financials are based on the most recent Mortgage that was taken out on this home.
Original Mortgage
$69,100
Interest Rate
6.29%
Mortgage Type
Fannie Mae Freddie Mac
Purchase Details
Closed on
Jul 2, 2003
Sold by
Smith Willie E and Smith Betty J
Bought by
Smith Cynthia Kay
Purchase Details
Closed on
Aug 8, 1997
Sold by
Poole P Kaye and Armstrong Clare S
Bought by
Smith Willie E and Smith Betty J
Create a Home Valuation Report for This Property
The Home Valuation Report is an in-depth analysis detailing your home's value as well as a comparison with similar homes in the area
Home Values in the Area
Average Home Value in this Area
Purchase History
| Date | Buyer | Sale Price | Title Company |
|---|---|---|---|
| Owen Deborah G | -- | None Listed On Document | |
| Owen James Michael | -- | None Available | |
| Beauregard Deborah G | $95,000 | American Guaranty Title Co | |
| Smith Cynthia Kay | -- | -- | |
| Smith Willie E | $45,000 | -- |
Source: Public Records
Mortgage History
| Date | Status | Borrower | Loan Amount |
|---|---|---|---|
| Previous Owner | Beauregard Deborah G | $69,100 |
Source: Public Records
Tax History Compared to Growth
Tax History
| Year | Tax Paid | Tax Assessment Tax Assessment Total Assessment is a certain percentage of the fair market value that is determined by local assessors to be the total taxable value of land and additions on the property. | Land | Improvement |
|---|---|---|---|---|
| 2024 | $1,397 | $12,378 | $2,345 | $10,033 |
| 2023 | $1,397 | $12,377 | $2,442 | $9,935 |
| 2022 | $1,296 | $12,017 | $2,721 | $9,296 |
| 2021 | $1,256 | $11,667 | $3,111 | $8,556 |
| 2020 | $1,230 | $11,328 | $3,131 | $8,197 |
| 2019 | $1,190 | $10,998 | $3,257 | $7,741 |
| 2018 | $1,098 | $10,678 | $0 | $0 |
| 2017 | $1,062 | $10,366 | $3,480 | $6,886 |
| 2016 | $1,028 | $10,064 | $2,895 | $7,169 |
| 2015 | $1,042 | $10,100 | $2,895 | $7,205 |
| 2014 | $1,040 | $10,133 | $2,873 | $7,260 |
Source: Public Records
Map
Nearby Homes
- 3232 NW 21st St
- 3416 NW 20th St
- 3437 NW 20th St
- 3429 NW 19th St
- 3217 NW 22nd St
- 3216 NW 19th St
- 1819 N Woodward Ave
- 3517 NW 20th St
- 3104 NW 21st St
- 3105 NW 22nd St
- 3117 NW 23rd St
- 3316 NW 26th St
- 3326 NW 16th St
- 3157 NW 25th St
- 3424 NW 16th St
- 3405 NW 15th St
- 3517 NW 16th St
- 3132 NW 16th St
- 2208 N Brookline Ave
- 3701 NW 18th St
- 3321 NW 21st St
- 3329 NW 21st St
- 3317 NW 21st St
- 3333 NW 21st St
- 3315 NW 21st St
- 3337 NW 21st St
- 3324 NW 22nd St
- 3320 NW 22nd St
- 3328 NW 22nd St
- 3316 NW 22nd St
- 3332 NW 22nd St
- 3341 NW 21st St
- 3312 NW 22nd St
- 3336 NW 22nd St
- 3324 NW 21st St
- 3328 NW 21st St
- 3320 NW 21st St
- 3332 NW 21st St
- 3316 NW 21st St
- 3310 NW 22nd St