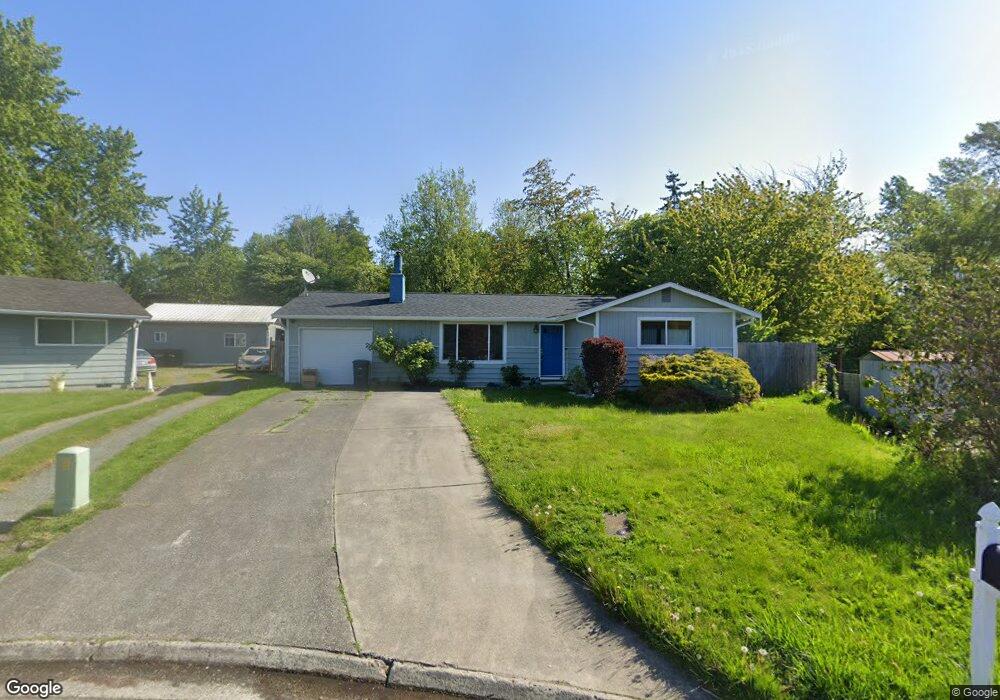
3326 Granada Way Bellingham, WA 98225
Estimated Value: $505,000 - $597,000
3
Beds
1
Bath
1,000
Sq Ft
$554/Sq Ft
Est. Value
About This Home
This home is located at 3326 Granada Way, Bellingham, WA 98225 and is currently estimated at $553,515, approximately $553 per square foot. 3326 Granada Way is a home located in Whatcom County with nearby schools including Alderwood Elementary School, Shuksan Middle School, and Squalicum High School.
Ownership History
Date
Name
Owned For
Owner Type
Purchase Details
Closed on
Jun 17, 2019
Sold by
Lembo Joseph and Lembo Joe
Bought by
Lembo Joseph and Lembo Brooks
Current Estimated Value
Home Financials for this Owner
Home Financials are based on the most recent Mortgage that was taken out on this home.
Original Mortgage
$224,500
Outstanding Balance
$197,390
Interest Rate
4.1%
Mortgage Type
New Conventional
Estimated Equity
$356,125
Purchase Details
Closed on
Nov 2, 2006
Sold by
Wilson Christy M
Bought by
Lembo Joe
Home Financials for this Owner
Home Financials are based on the most recent Mortgage that was taken out on this home.
Original Mortgage
$44,000
Interest Rate
5.98%
Mortgage Type
Stand Alone Second
Purchase Details
Closed on
Feb 19, 2004
Sold by
Singh Tarsem and Kaur Balwinder
Bought by
Wilson Christy M
Home Financials for this Owner
Home Financials are based on the most recent Mortgage that was taken out on this home.
Original Mortgage
$144,300
Interest Rate
5.12%
Mortgage Type
Purchase Money Mortgage
Create a Home Valuation Report for This Property
The Home Valuation Report is an in-depth analysis detailing your home's value as well as a comparison with similar homes in the area
Home Values in the Area
Average Home Value in this Area
Purchase History
| Date | Buyer | Sale Price | Title Company |
|---|---|---|---|
| Lembo Joseph | -- | Solidifi Title Agency Llc | |
| Lembo Joe | $220,280 | First American Title Insuran | |
| Wilson Christy M | $130,565 | Whatcom Land Title |
Source: Public Records
Mortgage History
| Date | Status | Borrower | Loan Amount |
|---|---|---|---|
| Open | Lembo Joseph | $224,500 | |
| Closed | Lembo Joe | $44,000 | |
| Closed | Lembo Joe | $176,000 | |
| Previous Owner | Wilson Christy M | $144,300 |
Source: Public Records
Tax History Compared to Growth
Tax History
| Year | Tax Paid | Tax Assessment Tax Assessment Total Assessment is a certain percentage of the fair market value that is determined by local assessors to be the total taxable value of land and additions on the property. | Land | Improvement |
|---|---|---|---|---|
| 2024 | $4,148 | $458,536 | $235,224 | $223,312 |
| 2023 | $4,148 | $478,703 | $245,570 | $233,133 |
| 2022 | $3,480 | $389,189 | $199,650 | $189,539 |
| 2021 | $2,941 | $321,644 | $165,000 | $156,644 |
| 2020 | $2,746 | $255,809 | $116,828 | $138,981 |
| 2019 | $2,448 | $239,038 | $109,238 | $129,800 |
| 2018 | $2,524 | $214,405 | $97,988 | $116,417 |
| 2017 | $2,200 | $189,707 | $86,700 | $103,007 |
| 2016 | $1,942 | $172,449 | $78,900 | $93,549 |
| 2015 | $2,137 | $164,222 | $75,000 | $89,222 |
| 2014 | -- | $175,699 | $72,240 | $103,459 |
| 2013 | -- | $168,509 | $70,000 | $98,509 |
Source: Public Records
Map
Nearby Homes
- 3311 Redwood Ave Unit 13
- 3333 Redwood Ave Unit 9
- 3305 Hollywood Ave
- 3333 Hollywood Ave
- 3319 Hollywood Ave
- 3222 Locust Ave
- 3132 Alderwood Ave
- 888 Marine Dr
- 3241 W Mcleod Rd
- 3222 Mcleod Rd
- 3161 Locust Ave
- 3057 Mcleod Rd
- 3085 W Maplewood Ave
- 2850 W Maplewood Ave
- 3851 Cliffside Dr
- 2829 Cottonwood Ave
- 2817 Mcleod Rd
- 2812 Nome St
- 2715 W Maplewood Ave Unit 122
- 2713 W Maplewood Ave Unit 311
- 3328 Granada Way
- 3324 Granada Way
- 3330 Granada Way
- 3322 Granada Way
- 3332 Granada Way
- 3334 Granada Way
- 3336 Granada Way
- 3311 Redwood Ave Unit 12
- 3311 Redwood Ave Unit 11
- 3311 Redwood Ave Unit 10
- 3311 Redwood Ave Unit 9
- 3311 Redwood Ave Unit 8
- 3311 Redwood Ave Unit 7
- 3311 Redwood Ave Unit 6
- 3311 Redwood Ave Unit 5
- 3311 Redwood Ave Unit 3
- 3311 Redwood Ave Unit 2
- 3311 Redwood Ave Unit 1
- 3311 Redwood Ave Unit 8