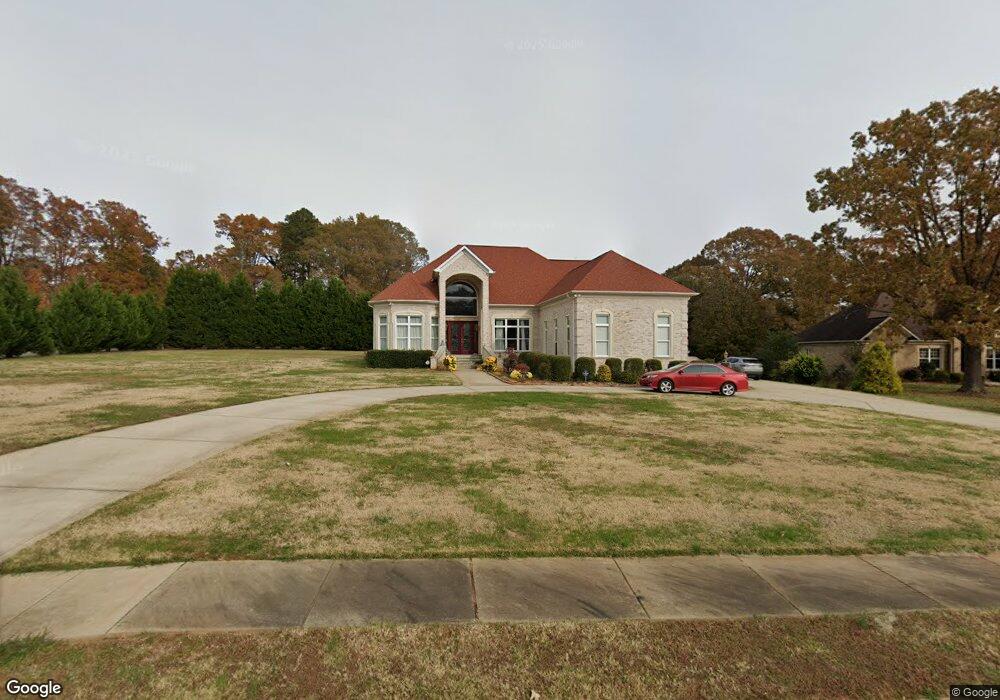
3326 Mayhew Forrest Ln Mint Hill, NC 28227
Estimated Value: $725,351 - $866,000
4
Beds
3
Baths
3,825
Sq Ft
$207/Sq Ft
Est. Value
About This Home
This home is located at 3326 Mayhew Forrest Ln, Mint Hill, NC 28227 and is currently estimated at $793,088, approximately $207 per square foot. 3326 Mayhew Forrest Ln is a home located in Mecklenburg County with nearby schools including Bain Elementary, Mint Hill Middle School, and Independence High.
Ownership History
Date
Name
Owned For
Owner Type
Purchase Details
Closed on
Jun 27, 2011
Sold by
Yeremuk Vasiliy and Yeremuk Lubov
Bought by
Tu Ha T and Phan Quang
Current Estimated Value
Home Financials for this Owner
Home Financials are based on the most recent Mortgage that was taken out on this home.
Original Mortgage
$308,000
Outstanding Balance
$213,290
Interest Rate
4.65%
Mortgage Type
New Conventional
Estimated Equity
$579,798
Purchase Details
Closed on
Jun 22, 2004
Sold by
Torres Malcolm A and Torres Jannine L
Bought by
Yeremuk Vasiliy and Yeremuk Lubov
Purchase Details
Closed on
Aug 5, 2002
Sold by
Mayhew L P and Mayhew Audrey
Bought by
Torres Malcolm A and Torres Jannine L
Home Financials for this Owner
Home Financials are based on the most recent Mortgage that was taken out on this home.
Original Mortgage
$40,797
Interest Rate
6.62%
Create a Home Valuation Report for This Property
The Home Valuation Report is an in-depth analysis detailing your home's value as well as a comparison with similar homes in the area
Home Values in the Area
Average Home Value in this Area
Purchase History
| Date | Buyer | Sale Price | Title Company |
|---|---|---|---|
| Tu Ha T | $385,000 | None Available | |
| Yeremuk Vasiliy | $53,000 | -- | |
| Torres Malcolm A | $54,000 | -- |
Source: Public Records
Mortgage History
| Date | Status | Borrower | Loan Amount |
|---|---|---|---|
| Open | Tu Ha T | $308,000 | |
| Previous Owner | Torres Malcolm A | $40,797 |
Source: Public Records
Tax History
| Year | Tax Paid | Tax Assessment Tax Assessment Total Assessment is a certain percentage of the fair market value that is determined by local assessors to be the total taxable value of land and additions on the property. | Land | Improvement |
|---|---|---|---|---|
| 2025 | $4,476 | $625,100 | $120,000 | $505,100 |
| 2024 | $4,476 | $625,100 | $120,000 | $505,100 |
| 2023 | $4,408 | $625,100 | $120,000 | $505,100 |
| 2022 | $4,251 | $483,000 | $60,000 | $423,000 |
| 2021 | $4,251 | $483,000 | $60,000 | $423,000 |
| 2020 | $4,251 | $483,000 | $60,000 | $423,000 |
| 2019 | $4,245 | $483,000 | $60,000 | $423,000 |
| 2018 | $4,659 | $423,700 | $58,500 | $365,200 |
| 2017 | $4,624 | $423,700 | $58,500 | $365,200 |
| 2016 | $4,621 | $423,700 | $58,500 | $365,200 |
| 2015 | $4,617 | $413,100 | $58,500 | $354,600 |
| 2014 | $4,500 | $413,100 | $58,500 | $354,600 |
Source: Public Records
Map
Nearby Homes
- 5221 Blackjack Ln
- 5243 Mintridge Rd
- 12900 Ruth Haven Dr
- 7362 Purple Martin Way
- 7400 Purple Martin Way
- 13418 Castleford Dr
- 4027 Mintwood Dr
- 6421 Joli Cheval Ln Unit 9
- 4500 Matthews Mint Hill Rd
- 13530 Four Oaks Ln
- 13909 Idlewild Rd
- 12510 Idlewild Rd
- 12514 Idlewild Rd
- 6639 Joli Cheval Ln Unit 4
- 3824 Matthews Mint Hill Rd
- 14348 Brooks Knoll Ln
- 6157 Volte Dr Unit 93
- 14409 Springwater Dr
- 2530 Weathersford Rd
- 4116 Hoodridge Ln
- 3312 Mayhew Forrest Ln
- 3338 Mayhew Forrest Ln
- 3329 Rusty Ct
- 3325 Mayhew Forrest Ln
- 3304 Mayhew Forrest Ln
- 3337 Mayhew Forrest Ln
- 3350 Mayhew Forrest Ln
- 3320 Rusty Ct
- 3313 Mayhew Forrest Ln
- 5225 Mayhew Country Dr
- 14915 Oregon Oak Ct
- 13113 Fairington Oaks Dr
- 3349 Mayhew Forrest Ln
- 13103 Fairington Oaks Dr
- 6604 Northern Red Oak Dr
- 6604 Northern Red Oak Dr Unit 122
- 13119 Fairington Oaks Dr
- 13119 Fairington Oaks Dr Unit 125
- 5303 Mayhew Country Dr
- 14919 Oregon Oak Ct
Your Personal Tour Guide
Ask me questions while you tour the home.