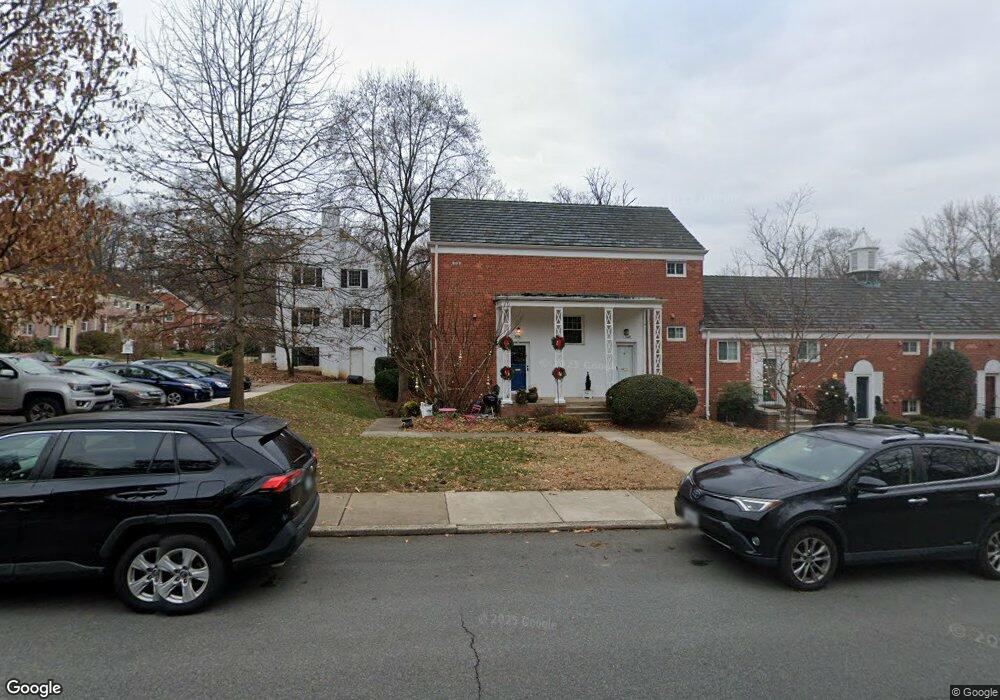
3326 Valley Dr Alexandria, VA 22302
North Ridge NeighborhoodEstimated Value: $332,000 - $352,000
1
Bed
1
Bath
750
Sq Ft
$454/Sq Ft
Est. Value
About This Home
This home is located at 3326 Valley Dr, Alexandria, VA 22302 and is currently estimated at $340,830, approximately $454 per square foot. 3326 Valley Dr is a home located in Alexandria City with nearby schools including Charles Barrett Elementary School, George Washington Middle School, and Alexandria City High School.
Ownership History
Date
Name
Owned For
Owner Type
Purchase Details
Closed on
Jun 14, 2023
Sold by
Frank Bryan S
Bought by
Gabel Meredith Lucas
Current Estimated Value
Home Financials for this Owner
Home Financials are based on the most recent Mortgage that was taken out on this home.
Original Mortgage
$329,800
Outstanding Balance
$320,981
Interest Rate
6.39%
Mortgage Type
New Conventional
Estimated Equity
$19,849
Purchase Details
Closed on
Aug 15, 2018
Sold by
Robinson Christopher J and Robinson Anne B
Bought by
Tianti Sarah E and Tianti Frank Bryan
Home Financials for this Owner
Home Financials are based on the most recent Mortgage that was taken out on this home.
Original Mortgage
$257,050
Interest Rate
4.5%
Mortgage Type
New Conventional
Purchase Details
Closed on
May 13, 2014
Sold by
Robinson Christopher J and Robinson Anne B
Bought by
Robinson Christopher J and Robinson Anne B
Create a Home Valuation Report for This Property
The Home Valuation Report is an in-depth analysis detailing your home's value as well as a comparison with similar homes in the area
Home Values in the Area
Average Home Value in this Area
Purchase History
| Date | Buyer | Sale Price | Title Company |
|---|---|---|---|
| Gabel Meredith Lucas | $340,000 | Old American Title | |
| Tianti Sarah E | $265,000 | Attorney | |
| Robinson Christopher J | -- | -- |
Source: Public Records
Mortgage History
| Date | Status | Borrower | Loan Amount |
|---|---|---|---|
| Open | Gabel Meredith Lucas | $329,800 | |
| Previous Owner | Tianti Sarah E | $257,050 |
Source: Public Records
Tax History Compared to Growth
Tax History
| Year | Tax Paid | Tax Assessment Tax Assessment Total Assessment is a certain percentage of the fair market value that is determined by local assessors to be the total taxable value of land and additions on the property. | Land | Improvement |
|---|---|---|---|---|
| 2025 | $3,373 | $324,411 | $103,409 | $221,002 |
| 2024 | $3,373 | $289,394 | $98,485 | $190,909 |
| 2023 | $3,180 | $286,529 | $97,510 | $189,019 |
| 2022 | $3,118 | $280,911 | $95,598 | $185,313 |
| 2021 | $3,057 | $275,380 | $93,701 | $181,679 |
| 2020 | $2,788 | $250,346 | $85,183 | $165,163 |
| 2019 | $2,669 | $236,175 | $80,361 | $155,814 |
| 2018 | $882 | $78,020 | $78,020 | $0 |
| 2017 | $2,517 | $222,775 | $75,905 | $146,870 |
| 2016 | $2,439 | $227,317 | $75,905 | $151,412 |
| 2015 | $2,620 | $251,171 | $75,905 | $175,266 |
| 2014 | $2,549 | $244,430 | $75,905 | $168,525 |
Source: Public Records
Map
Nearby Homes
- 3237 Ravensworth Place
- 1650 Preston Rd
- 3325 Valley Dr
- 1649 Preston Rd
- 1627 Ripon Place Unit 835
- 3249 Martha Custis Dr Unit 847
- 1609 Preston Rd
- 1119 Beverley Dr
- 1603 Mount Eagle Place
- 3519 Valley Dr
- 3106 Ravensworth Place
- 1121 Allison St
- 1615 Mount Eagle Place
- 3332 Martha Custis Dr
- 1002 Beverley Dr
- 3513 Martha Custis Dr
- 3460 Martha Custis Dr
- 3492 Martha Custis Dr
- 1640 Fitzgerald Ln
- 3614 Valley Dr
- 3326 Valley Dr Unit 808-33
- 3328 Valley Dr
- 3324 Valley Dr
- 3330 Valley Dr
- 3332 Valley Dr Unit 808
- 3332 Valley Dr
- 3332 Valley Dr Unit 808-33
- 3342 Valley Dr Unit 808
- 3342 Valley Dr
- 3342 Valley Dr Unit 808-33
- 3334 Valley Dr
- 3336 Valley Dr
- 3336 Valley Dr Unit 808-33
- 3318 Valley Dr
- 3338 Valley Dr Unit 808-33
- 3338 Valley Dr
- 3338 Valley Dr Unit 808
- 3320 Valley Dr
- 3314 Valley Dr
- 3316 Valley Dr