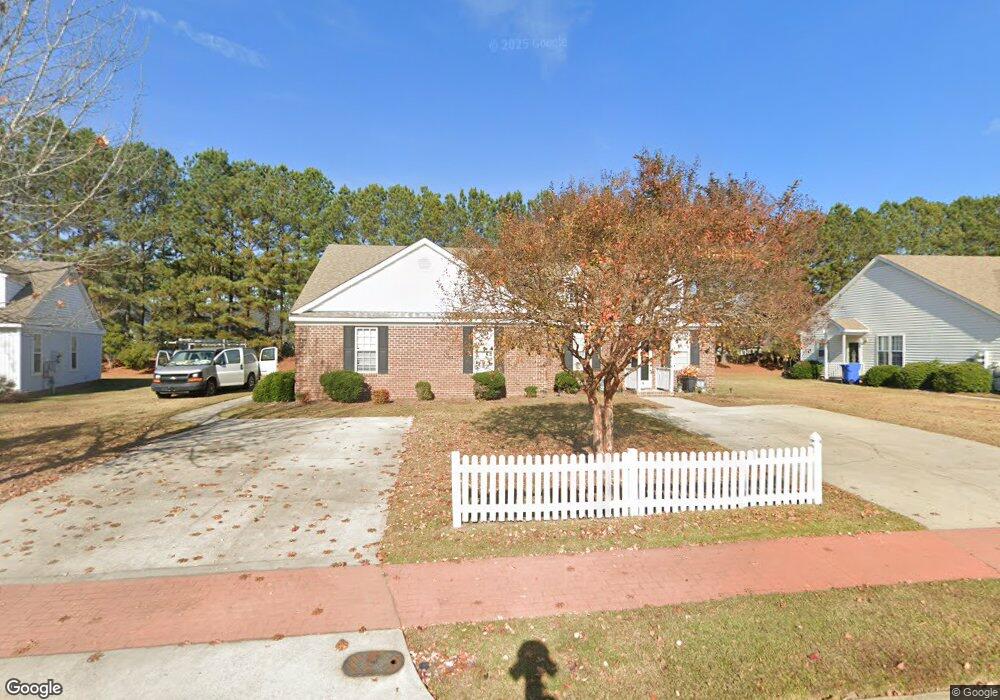
3326 Whitlock Dr N Wilson, NC 27896
Estimated Value: $254,000 - $339,000
About This Home
You will feel at home in this serene and private community. Currently, we have available a 3 bedroom apartment for $1,345 per month. This one-story duplex town home features a unique floor plans, custom cabinetry and tile, carpet and tile floors. Appliance amenities include stove, refrigerator and microwave.There is a paved driveway and patio. Also, paved sidewalks are throughout the subdivision. Large sunlit rooms and nine-foot ceilings give these homes a bright and airy feeling. Lawn maintenance is included in the rent. You will be within minutes of several of Wilson's best local restaurants and a short drive to shopping centers and parks. All of these amenities are included in the rent for just $1,345 per month!
Property Features include:
Cable/Internet Ready
All End Units
Blinds
Built-In Microwave
Ceiling Fans
Central Heat/Air
Cabinetry
Dead Bolts
Dishwasher
Eat-in Kitchen
Enclosed Washer/Dryer HooK-Ups
Exterior Faucets and Electrical Outlets
Front and Rear Entry
Garbage Disposal
Individual Yards
Nine Foot Ceilings
Oven/Range
Pantry
Patio/Deck
Private Driveway
Private Outside Storage
Refrigerator with Icemaker
Unsurpassed Sound Proofing
Walk-In Closets
Professionally Landscaped
Great Location
Sidewalks
Owner pays for lawn maintenance, electrical/plumbing and heat/ac repairs
Home Values in the Area
Average Home Value in this Area
Property History
| Date | Event | Price | List to Sale | Price per Sq Ft |
|---|---|---|---|---|
| 02/13/2025 02/13/25 | Off Market | $1,345 | -- | -- |
| 02/10/2025 02/10/25 | Off Market | -- | -- | -- |
| 02/08/2025 02/08/25 | Price Changed | $1,345 | -3.6% | $1 / Sq Ft |
| 01/21/2025 01/21/25 | For Rent | $1,395 | 0.0% | -- |
| 01/17/2025 01/17/25 | For Rent | -- | -- | -- |
| 12/31/2024 12/31/24 | For Rent | $1,395 | -- | -- |
Tax History Compared to Growth
Tax History
| Year | Tax Paid | Tax Assessment Tax Assessment Total Assessment is a certain percentage of the fair market value that is determined by local assessors to be the total taxable value of land and additions on the property. | Land | Improvement |
|---|---|---|---|---|
| 2025 | $1,473 | $247,505 | $35,000 | $212,505 |
| 2024 | $1,473 | $247,505 | $35,000 | $212,505 |
| 2023 | $2,027 | $155,350 | $35,000 | $120,350 |
| 2022 | $2,027 | $155,350 | $35,000 | $120,350 |
| 2021 | $2,027 | $155,350 | $35,000 | $120,350 |
| 2020 | $2,027 | $155,350 | $35,000 | $120,350 |
| 2019 | $2,027 | $155,350 | $35,000 | $120,350 |
| 2018 | $0 | $155,350 | $35,000 | $120,350 |
| 2017 | $1,996 | $155,350 | $35,000 | $120,350 |
| 2016 | $1,996 | $155,350 | $35,000 | $120,350 |
| 2014 | $1,733 | $139,158 | $35,000 | $104,158 |
Map
- 3645 Eagle Farm Dr N
- 3702 Arrowwood Dr N
- 3902 Redbay Ln
- 3806 Wyattwood Dr N
- 3202 Walbrook Place N
- 3311 Westshire Dr
- 2911 Ridge Rd NW
- 2803 Ardsley Rd N
- 2906 Brentwood Dr N
- 2811 Deerfield Ln N
- 2602 Buckingham Rd NW
- 2411 Canal Dr NW
- 2834 Lancaster Rd NW
- 2405 Williamsburg Dr NW
- 3704 Shadow Ridge Rd N
- 2313 Foxcroft Rd NW
- 2400 Bradford Dr N Unit 7b
- 2214 Nash Place N
- 3530 Shadow Ridge Rd N
- 2603 Westminster Dr NW
- 3518 Whetstone Place N
- 3520 Whetstone Place N
- 3516 Whetstone Place N
- 3330 Whitlock Dr N
- 3321 Whitlock Dr N
- 3514 Whetstone Place N
- 3522 Whetstone Place N
- 3320 Whitlock Dr N
- 3524 Whetstone Place N
- 3512 Whetstone Place N
- 3334 Whitlock Dr N
- 3329 Whitlock Dr N
- 3526 Whetstone Place N
- 3519 Whetstone Place N
- 3517 Whetstone Place N
- 3523 Whetstone Place N
- 3515 Whetstone Place N
- 3513 Whetstone Place N
- 3528 Whetstone Place N
- 3525 Whetstone Place N