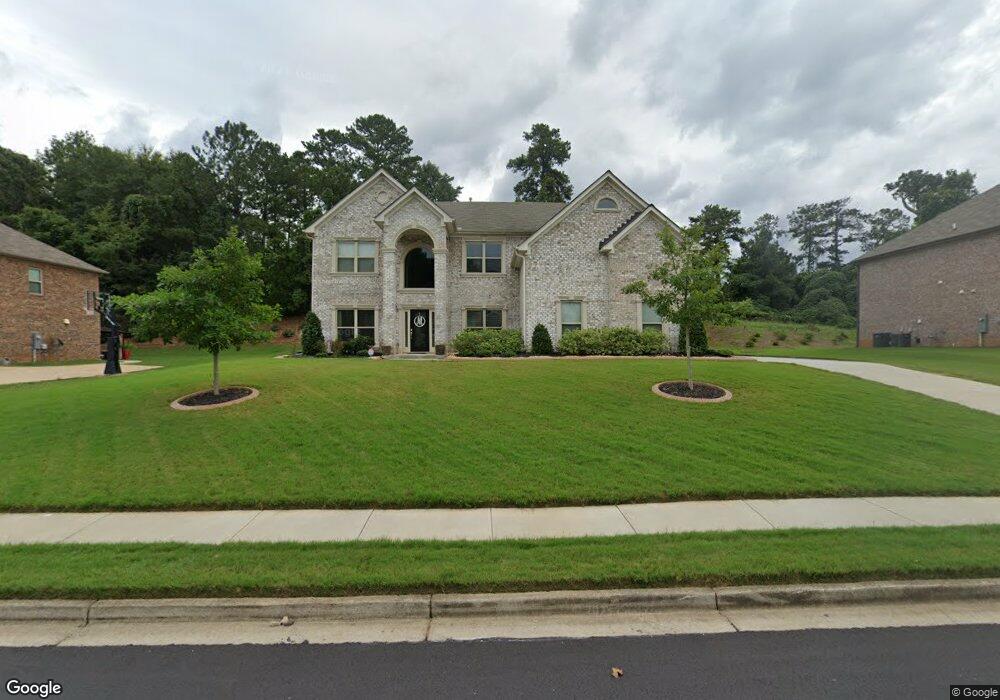
3327 Bartlett Ave Unit 26 Conyers, GA 30013
Estimated Value: $520,000 - $619,000
5
Beds
4
Baths
3,645
Sq Ft
$156/Sq Ft
Est. Value
About This Home
This home is located at 3327 Bartlett Ave Unit 26, Conyers, GA 30013 and is currently estimated at $569,146, approximately $156 per square foot. 3327 Bartlett Ave Unit 26 is a home located in Rockdale County with nearby schools including Flat Shoals Elementary School, Memorial Middle School, and Salem High School.
Ownership History
Date
Name
Owned For
Owner Type
Purchase Details
Closed on
Mar 16, 2020
Sold by
Mapp Zandra
Bought by
Mapp Zandra and Mapp Orlando M
Current Estimated Value
Purchase Details
Closed on
Dec 15, 2017
Sold by
Green River Builders Inc
Bought by
Mapp Zandra
Home Financials for this Owner
Home Financials are based on the most recent Mortgage that was taken out on this home.
Original Mortgage
$284,601
Interest Rate
3.95%
Mortgage Type
New Conventional
Purchase Details
Closed on
Sep 19, 2017
Sold by
Hollis Thomas G
Bought by
Green River Builders Inc
Home Financials for this Owner
Home Financials are based on the most recent Mortgage that was taken out on this home.
Original Mortgage
$251,100
Interest Rate
3.86%
Mortgage Type
Purchase Money Mortgage
Purchase Details
Closed on
Feb 22, 2017
Sold by
Not Provided
Bought by
Hollis Thomas G
Purchase Details
Closed on
Mar 22, 2013
Sold by
Mccart Landing Conyers Llc
Bought by
Cdt Complex Llc
Create a Home Valuation Report for This Property
The Home Valuation Report is an in-depth analysis detailing your home's value as well as a comparison with similar homes in the area
Home Values in the Area
Average Home Value in this Area
Purchase History
| Date | Buyer | Sale Price | Title Company |
|---|---|---|---|
| Mapp Zandra | $334,825 | -- | |
| Mapp Zandra | $334,825 | -- | |
| Green River Builders Inc | $26,500 | -- | |
| Hollis Thomas G | $133,000 | -- | |
| Cdt Complex Llc | $208,000 | -- |
Source: Public Records
Mortgage History
| Date | Status | Borrower | Loan Amount |
|---|---|---|---|
| Previous Owner | Mapp Zandra | $284,601 | |
| Previous Owner | Green River Builders Inc | $251,100 |
Source: Public Records
Tax History Compared to Growth
Tax History
| Year | Tax Paid | Tax Assessment Tax Assessment Total Assessment is a certain percentage of the fair market value that is determined by local assessors to be the total taxable value of land and additions on the property. | Land | Improvement |
|---|---|---|---|---|
| 2024 | $6,221 | $242,400 | $54,720 | $187,680 |
| 2023 | $5,421 | $219,280 | $51,800 | $167,480 |
| 2022 | $4,784 | $194,440 | $36,000 | $158,440 |
| 2021 | $4,380 | $167,040 | $31,600 | $135,440 |
| 2020 | $3,937 | $144,120 | $25,600 | $118,520 |
| 2019 | $3,527 | $127,640 | $18,800 | $108,840 |
| 2018 | $3,550 | $127,640 | $18,800 | $108,840 |
| 2017 | $545 | $14,080 | $14,080 | $0 |
| 2016 | $746 | $15,000 | $15,000 | $0 |
| 2015 | $610 | $12,000 | $12,000 | $0 |
| 2014 | $174 | $2,400 | $2,400 | $0 |
| 2013 | -- | $4,000 | $4,000 | $0 |
Source: Public Records
Map
Nearby Homes
- 3177 Spring Lake Dr NE
- 3096 Old Covington Rd NE Unit 2
- 2506 Ginger Leaf Dr NE
- 0 Mccart Rd NE Unit 10200314
- 0 Mccart Rd NE Unit 7272212
- 2725 Bailey Place NE
- 2200 Ginger Lake Dr NE
- 2710 Glendale Dr NE
- 2615 Glendale Dr NE
- 760 Almon Rd
- 140 Helm Dr
- 2567 Gees Mill Rd NE
- 110 Helm Dr
- 215 Providence Pkwy
- 330 Piedmont Cir
- 360 Glen Rd NE
- 90 Partridge Dr
- 2260 Ashton Ridge Dr SE
- 2100 NE Adel Rd
- 3327 Bartlett Ave
- 3325 Bartlett Ave Unit 25
- 3325 Bartlett Ave
- 3329 Bartlett Ave Unit 27
- 3329 Bartlett Ave
- 3323 Bartlett Ave Unit 24
- 3323 Bartlett Ave
- 3326 Bartlett Ave
- 3331 Bartlett Ave Unit 28
- 3331 Bartlett Ave
- 3324 Bartlett Ave Unit 395
- 3324 Bartlett Ave
- 3330 Bartlett Ave
- 3333 Bartlett Ave Unit 29
- 3333 Bartlett Ave
- 3322 Bartlett Ave Unit 396
- 3322 Bartlett Ave
- 3321 Bartlett Ave Unit 23
- 3321 Bartlett Ave
- 3334 Bartlett Ave