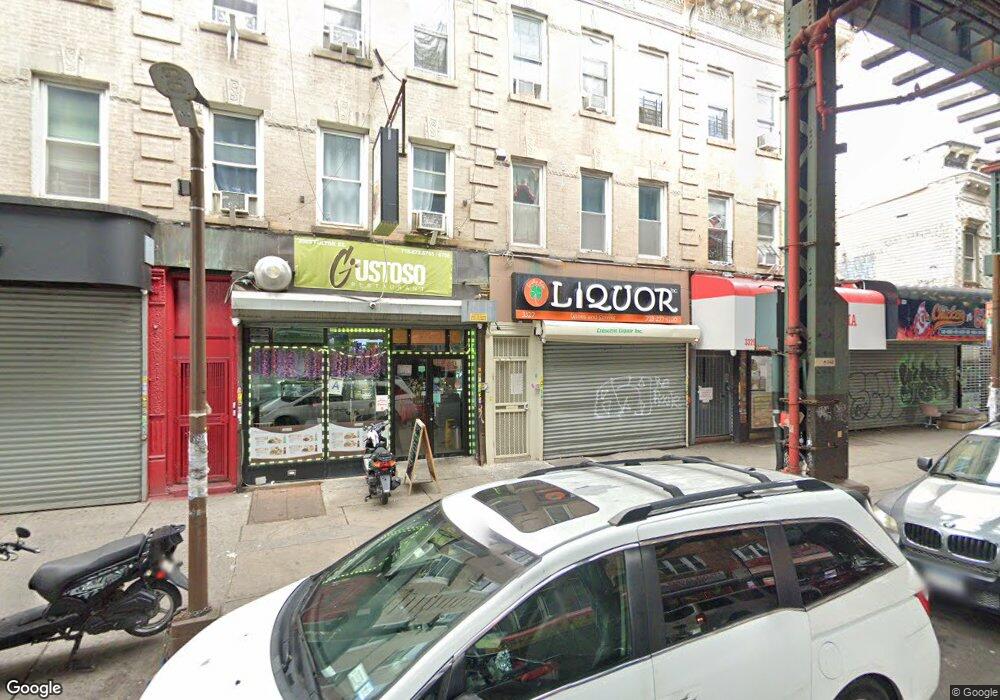
3327 Fulton St Unit 2A Brooklyn, NY 11208
Cypress Hills NeighborhoodEstimated Value: $1,155,603
1
Bed
1
Bath
3,285
Sq Ft
$352/Sq Ft
Est. Value
About This Home
This home is located at 3327 Fulton St Unit 2A, Brooklyn, NY 11208 and is currently estimated at $1,155,603, approximately $351 per square foot. 3327 Fulton St Unit 2A is a home located in Kings County with nearby schools including P.S. 65, Is 171 Abraham Lincoln, and Blessed Sacrament School.
Ownership History
Date
Name
Owned For
Owner Type
Purchase Details
Closed on
Jan 6, 2012
Sold by
Wing Wong Assets Llc
Bought by
Ren & Fu Inc
Current Estimated Value
Home Financials for this Owner
Home Financials are based on the most recent Mortgage that was taken out on this home.
Original Mortgage
$300,000
Outstanding Balance
$205,277
Interest Rate
3.94%
Mortgage Type
Commercial
Estimated Equity
$950,326
Purchase Details
Closed on
Feb 23, 2009
Sold by
Rodriguez Santiago
Bought by
Wing Wong Assets Llc
Purchase Details
Closed on
Aug 2, 2006
Sold by
Rodriguez Israel A
Bought by
Rodriguez Santiago
Home Financials for this Owner
Home Financials are based on the most recent Mortgage that was taken out on this home.
Original Mortgage
$604,000
Interest Rate
6.88%
Mortgage Type
Commercial
Purchase Details
Closed on
Jul 9, 2004
Sold by
Howell David and Howell John
Bought by
Rodriguez Israel A
Home Financials for this Owner
Home Financials are based on the most recent Mortgage that was taken out on this home.
Original Mortgage
$320,000
Interest Rate
6.28%
Mortgage Type
Commercial
Create a Home Valuation Report for This Property
The Home Valuation Report is an in-depth analysis detailing your home's value as well as a comparison with similar homes in the area
Home Values in the Area
Average Home Value in this Area
Purchase History
| Date | Buyer | Sale Price | Title Company |
|---|---|---|---|
| Ren & Fu Inc | $600,000 | -- | |
| Wing Wong Assets Llc | $490,000 | -- | |
| Rodriguez Santiago | $650,000 | -- | |
| Rodriguez Israel A | $450,000 | -- |
Source: Public Records
Mortgage History
| Date | Status | Borrower | Loan Amount |
|---|---|---|---|
| Open | Ren & Fu Inc | $300,000 | |
| Previous Owner | Rodriguez Santiago | $604,000 | |
| Previous Owner | Rodriguez Israel A | $320,000 |
Source: Public Records
Tax History
| Year | Tax Paid | Tax Assessment Tax Assessment Total Assessment is a certain percentage of the fair market value that is determined by local assessors to be the total taxable value of land and additions on the property. | Land | Improvement |
|---|---|---|---|---|
| 2025 | $5,805 | $53,160 | $10,800 | $42,360 |
| 2024 | $5,805 | $49,380 | $10,800 | $38,580 |
| 2023 | $5,808 | $60,600 | $10,800 | $49,800 |
| 2022 | $5,404 | $48,780 | $10,800 | $37,980 |
| 2021 | $5,695 | $44,160 | $10,800 | $33,360 |
| 2020 | $2,671 | $40,260 | $10,800 | $29,460 |
| 2019 | $5,038 | $40,260 | $10,800 | $29,460 |
| 2018 | $4,858 | $23,832 | $7,674 | $16,158 |
| 2017 | $4,599 | $22,560 | $7,794 | $14,766 |
| 2016 | $4,508 | $22,549 | $9,352 | $13,197 |
| 2015 | $2,567 | $21,273 | $10,578 | $10,695 |
| 2014 | $2,567 | $20,071 | $9,817 | $10,254 |
Source: Public Records
Map
Nearby Homes
- 169 Euclid Ave
- 9 Adler Place
- 243 Crescent St
- 235 Hemlock St
- 451 Ridgewood Ave
- 145 Chestnut St
- 165 Chestnut St
- 477 Ridgewood Ave
- 294 Hemlock St
- 342 Ridgewood Ave
- 213 Autumn Ave
- 3235 Fulton St
- 182 Lincoln Ave
- 3225 Fulton St
- 261 Etna St
- 289 Etna St
- 255 Lincoln Ave
- 147 Autumn Ave
- 317 Etna St
- 272 Nichols Ave
- 3327 Fulton St
- 3325 Fulton St
- 3329 Fulton St Unit 2
- 3329 Fulton St
- 3331 Fulton St
- 3321 Fulton St
- 3319 Fulton St
- 3319 Fulton St Unit 2
- 3333 Fulton St
- 3317 Fulton St
- 121 Pine St
- 3335 Fulton St
- 117 Pine St
- 3337 Fulton St
- 115 Pine St
- 3328 Fulton St Unit 1FL
- 3328 Fulton St
- 3341-3343 Fulton St
- 113 Pine St
- 3326 Fulton St
Your Personal Tour Guide
Ask me questions while you tour the home.