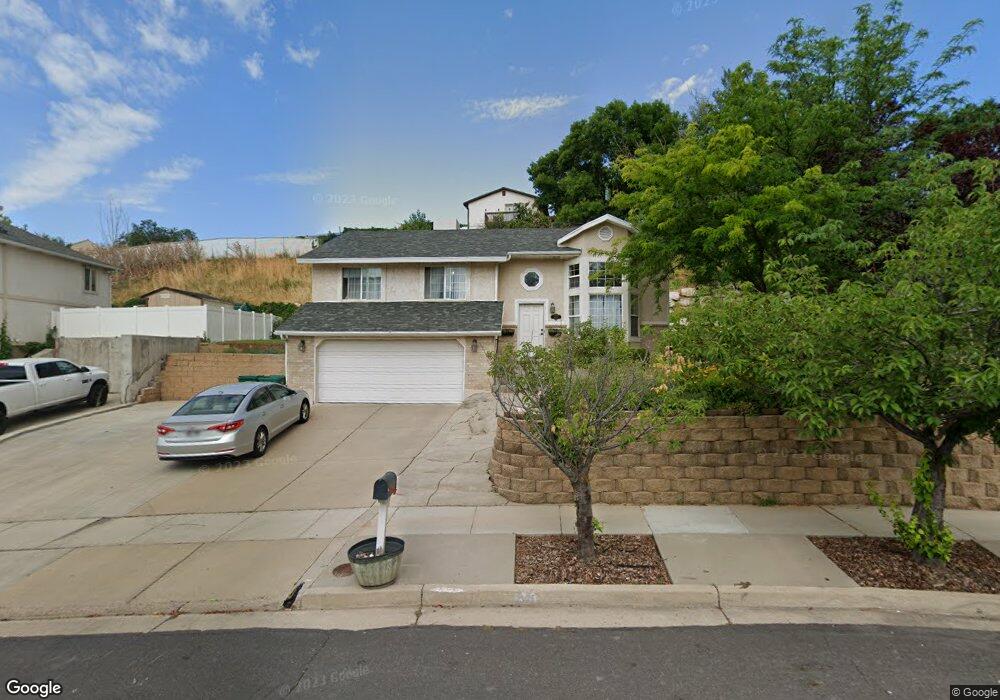
3327 N 1050 E Layton, UT 84040
Estimated Value: $456,030 - $467,000
4
Beds
3
Baths
1,713
Sq Ft
$270/Sq Ft
Est. Value
About This Home
This home is located at 3327 N 1050 E, Layton, UT 84040 and is currently estimated at $463,008, approximately $270 per square foot. 3327 N 1050 E is a home located in Davis County with nearby schools including Mountain View Elementary School, North Layton Junior High School, and Northridge High School.
Ownership History
Date
Name
Owned For
Owner Type
Purchase Details
Closed on
Sep 6, 2017
Sold by
Manwill Joel and Manwill Alicia Evans
Bought by
Ah4r Properties Llc
Current Estimated Value
Purchase Details
Closed on
Feb 2, 2001
Sold by
Manwill Joel
Bought by
Manwill Joel and Evans Manwill Alicia
Purchase Details
Closed on
Mar 20, 2000
Sold by
Beeton Hal M
Bought by
Manwill Joel
Home Financials for this Owner
Home Financials are based on the most recent Mortgage that was taken out on this home.
Original Mortgage
$126,125
Interest Rate
8.21%
Mortgage Type
FHA
Purchase Details
Closed on
Jun 24, 1997
Sold by
Beeton Hal M
Bought by
Beeton Hal M
Home Financials for this Owner
Home Financials are based on the most recent Mortgage that was taken out on this home.
Original Mortgage
$60,000
Interest Rate
7.91%
Mortgage Type
Balloon
Create a Home Valuation Report for This Property
The Home Valuation Report is an in-depth analysis detailing your home's value as well as a comparison with similar homes in the area
Home Values in the Area
Average Home Value in this Area
Purchase History
| Date | Buyer | Sale Price | Title Company |
|---|---|---|---|
| Ah4r Properties Llc | -- | Inwest Title | |
| Manwill Joel | -- | Merrill Title Company | |
| Manwill Joel | -- | Inwest Title Services Inc | |
| Beeton Hal M | -- | Bonneville Title Company Inc |
Source: Public Records
Mortgage History
| Date | Status | Borrower | Loan Amount |
|---|---|---|---|
| Previous Owner | Manwill Joel | $126,125 | |
| Previous Owner | Beeton Hal M | $60,000 |
Source: Public Records
Tax History
| Year | Tax Paid | Tax Assessment Tax Assessment Total Assessment is a certain percentage of the fair market value that is determined by local assessors to be the total taxable value of land and additions on the property. | Land | Improvement |
|---|---|---|---|---|
| 2025 | $2,148 | $225,500 | $108,640 | $116,860 |
| 2024 | $2,049 | $216,699 | $80,560 | $136,139 |
| 2023 | $2,028 | $207,900 | $77,290 | $130,609 |
| 2022 | $2,114 | $389,000 | $135,219 | $253,781 |
| 2021 | $1,961 | $296,000 | $120,731 | $175,269 |
| 2020 | $1,761 | $255,000 | $91,814 | $163,186 |
| 2019 | $1,749 | $248,000 | $75,543 | $172,457 |
| 2018 | $1,566 | $223,000 | $71,267 | $151,733 |
| 2016 | $1,288 | $94,600 | $33,835 | $60,765 |
| 2015 | $1,265 | $88,220 | $33,835 | $54,385 |
| 2014 | $1,264 | $90,127 | $33,835 | $56,292 |
| 2013 | -- | $77,572 | $28,952 | $48,620 |
Source: Public Records
Map
Nearby Homes
- 3306 N Fairfield Rd
- 3240 N Fairfield Rd Unit 6
- 935 E 3000 N Unit 183
- 935 E 3000 N Unit 175
- 935 E 3000 N Unit 165
- 935 E 3000 N Unit 26
- 935 E 3000 N Unit 90
- 935 E 3000 N Unit 27
- 935 E Highway 193 Unit 102
- 935 E 3000 N Unit 56
- 1266 E 3125 N
- 1321 E 3125 N
- 1241 E 3075 N
- 3176 N 1450 E
- 948 E Hercules Ct Unit 179
- 1447 E 2700 N
- 2826 N 1600 E
- 1827 E Whitetail Dr
- 1821 E Whitetail Way
- 1731 E 2825 N
Your Personal Tour Guide
Ask me questions while you tour the home.