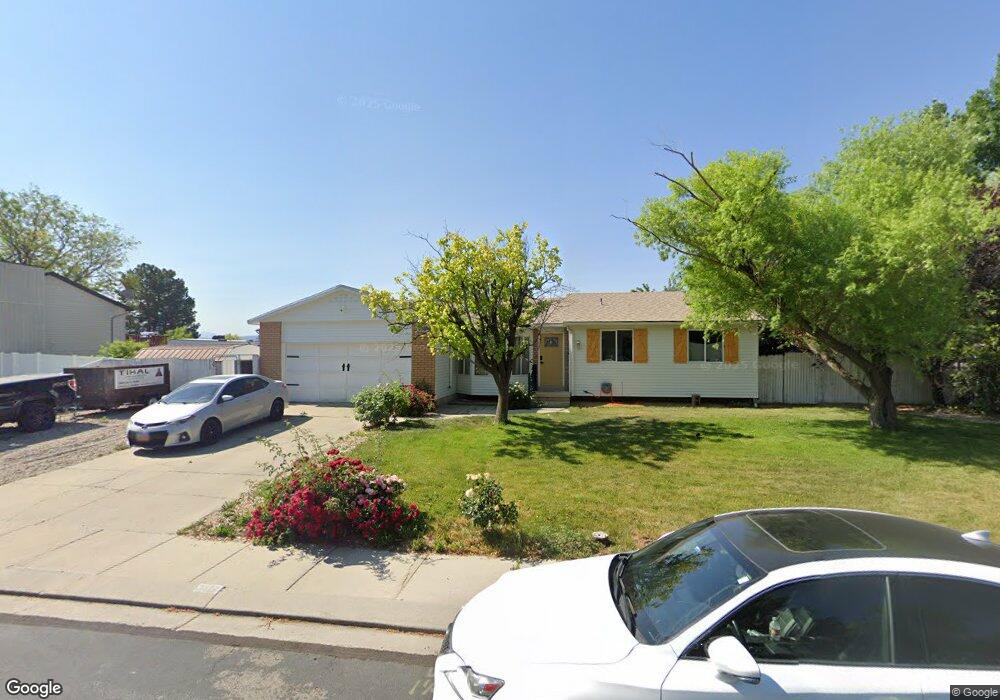
3327 W 6960 S West Jordan, UT 84084
Estimated Value: $523,000 - $577,000
5
Beds
3
Baths
2,289
Sq Ft
$243/Sq Ft
Est. Value
About This Home
This home is located at 3327 W 6960 S, West Jordan, UT 84084 and is currently estimated at $555,135, approximately $242 per square foot. 3327 W 6960 S is a home located in Salt Lake County with nearby schools including West Jordan Middle School, West Jordan High School, and Learning Tree School - Southwest.
Ownership History
Date
Name
Owned For
Owner Type
Purchase Details
Closed on
Apr 1, 2024
Sold by
Rawski Paul E and Rawski Belinda
Bought by
Johansen Rudyard Michael and Equity Trust
Current Estimated Value
Purchase Details
Closed on
Dec 9, 2022
Sold by
Sanchez Mario
Bought by
Rawski Paul E and Rawski Belinda
Home Financials for this Owner
Home Financials are based on the most recent Mortgage that was taken out on this home.
Original Mortgage
$299,475
Interest Rate
7.7%
Mortgage Type
FHA
Purchase Details
Closed on
Jan 17, 2013
Sold by
Rawski Balinda Liddell
Bought by
Sanchez Mario
Purchase Details
Closed on
Mar 1, 2000
Sold by
Liddell Eugene L and Liddell Yvonne S
Bought by
Liddell Eugene L and Liddell Yvonne S
Create a Home Valuation Report for This Property
The Home Valuation Report is an in-depth analysis detailing your home's value as well as a comparison with similar homes in the area
Home Values in the Area
Average Home Value in this Area
Purchase History
| Date | Buyer | Sale Price | Title Company |
|---|---|---|---|
| Johansen Rudyard Michael | -- | Pioneer Title | |
| Rawski Paul E | -- | Lendmark Closing Services | |
| Sanchez Mario | -- | Meridian Title | |
| Liddell Eugene L | -- | -- |
Source: Public Records
Mortgage History
| Date | Status | Borrower | Loan Amount |
|---|---|---|---|
| Previous Owner | Rawski Paul E | $299,475 | |
| Previous Owner | Rawski Paul E | $10,675 |
Source: Public Records
Tax History Compared to Growth
Tax History
| Year | Tax Paid | Tax Assessment Tax Assessment Total Assessment is a certain percentage of the fair market value that is determined by local assessors to be the total taxable value of land and additions on the property. | Land | Improvement |
|---|---|---|---|---|
| 2025 | $2,280 | $530,600 | $169,300 | $361,300 |
| 2024 | $2,280 | $438,700 | $162,200 | $276,500 |
| 2023 | $2,306 | $418,100 | $153,000 | $265,100 |
| 2022 | $2,295 | $409,400 | $150,000 | $259,400 |
| 2021 | $1,945 | $315,900 | $115,000 | $200,900 |
| 2020 | $1,837 | $280,000 | $115,000 | $165,000 |
| 2019 | $1,831 | $273,600 | $90,000 | $183,600 |
| 2018 | $1,721 | $255,100 | $86,900 | $168,200 |
| 2017 | $1,495 | $220,700 | $82,600 | $138,100 |
| 2016 | $1,419 | $196,700 | $82,600 | $114,100 |
| 2015 | $1,352 | $182,800 | $81,800 | $101,000 |
| 2014 | $1,331 | $177,100 | $80,200 | $96,900 |
Source: Public Records
Map
Nearby Homes
- 3383 W 6880 S
- 6893 S 3200 W
- 6968 S 3535 W Unit 3
- 6980 S 3535 W Unit 2
- 6672 S 3335 W
- 6863 S Dixie Dr
- 8524 S Michele River Ave W Unit 109
- 6992 W Terraine Rd
- 6978 W Terraine Rd
- 3660 Ashland Cir
- 6482 S Gold Medal Dr
- 3695 Carolina Dr
- 7458 Bromley Rd
- 3226 Tysonbrook Ct
- 6453 Fremont Peak Cir
- 6512 Timpanogos Way
- 6622 S Georgia Dr
- 6918 S Harvest Cir
- 3538 W Biathlon Cir
- 3305 W Kingsbrook Ave