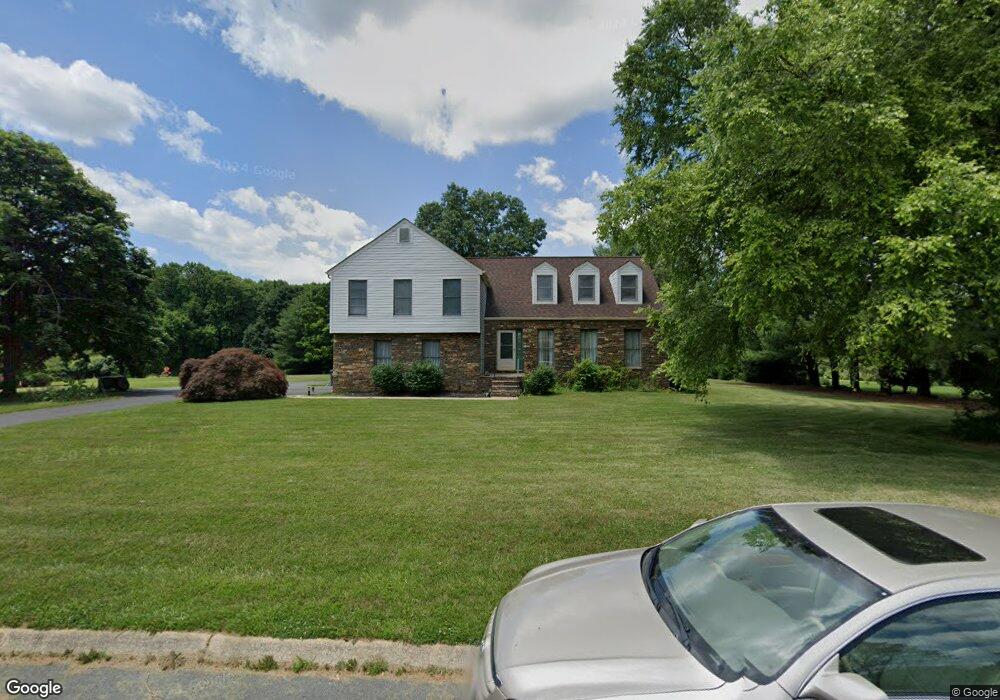
3328 Jo Ann Ln Fallston, MD 21047
Estimated Value: $574,000 - $865,000
Studio
3
Baths
3,340
Sq Ft
$220/Sq Ft
Est. Value
About This Home
This home is located at 3328 Jo Ann Ln, Fallston, MD 21047 and is currently estimated at $735,770, approximately $220 per square foot. 3328 Jo Ann Ln is a home located in Harford County with nearby schools including Jarrettsville Elementary School, Fallston Middle School, and Fallston High School.
Ownership History
Date
Name
Owned For
Owner Type
Purchase Details
Closed on
Jun 15, 2017
Sold by
Dargakis Minas J and Dargakis Sandra D
Bought by
Daragakis Minas John and Daragakis Sandra Dawn
Current Estimated Value
Purchase Details
Closed on
Aug 17, 2000
Sold by
Shinn Ralph A
Bought by
Dargakis Minas J and Dargakis Sandra D
Purchase Details
Closed on
Dec 19, 1985
Sold by
Schulte Homes Inc
Bought by
Shinn Ralph A
Home Financials for this Owner
Home Financials are based on the most recent Mortgage that was taken out on this home.
Original Mortgage
$65,000
Interest Rate
11.31%
Purchase Details
Closed on
Mar 21, 1985
Sold by
Haynes Nicholas V
Bought by
Schulte Homes Inc
Home Financials for this Owner
Home Financials are based on the most recent Mortgage that was taken out on this home.
Original Mortgage
$142,500
Interest Rate
13.2%
Create a Home Valuation Report for This Property
The Home Valuation Report is an in-depth analysis detailing your home's value as well as a comparison with similar homes in the area
Purchase History
| Date | Buyer | Sale Price | Title Company |
|---|---|---|---|
| Daragakis Minas John | -- | None Available | |
| Dargakis Minas J | $262,000 | -- | |
| Shinn Ralph A | $187,000 | -- | |
| Schulte Homes Inc | $38,000 | -- |
Source: Public Records
Mortgage History
| Date | Status | Borrower | Loan Amount |
|---|---|---|---|
| Previous Owner | Shinn Ralph A | $65,000 | |
| Previous Owner | Schulte Homes Inc | $142,500 | |
| Closed | Dargakis Minas J | -- |
Source: Public Records
Tax History
| Year | Tax Paid | Tax Assessment Tax Assessment Total Assessment is a certain percentage of the fair market value that is determined by local assessors to be the total taxable value of land and additions on the property. | Land | Improvement |
|---|---|---|---|---|
| 2025 | $5,674 | $544,600 | $0 | $0 |
| 2024 | $5,674 | $515,100 | $142,300 | $372,800 |
| 2023 | $5,612 | $509,400 | $0 | $0 |
| 2022 | $5,550 | $503,700 | $0 | $0 |
| 2021 | $11,287 | $498,000 | $142,300 | $355,700 |
| 2020 | $5,663 | $485,500 | $0 | $0 |
| 2019 | $5,518 | $473,000 | $0 | $0 |
| 2018 | $5,314 | $460,500 | $152,300 | $308,200 |
| 2017 | $5,326 | $460,500 | $0 | $0 |
| 2016 | -- | $460,500 | $0 | $0 |
| 2015 | $6,284 | $481,200 | $0 | $0 |
| 2014 | $6,284 | $481,200 | $0 | $0 |
Source: Public Records
Map
Nearby Homes
- 3203 Glouchester Dr
- 3204 Hunt Rd
- 3007 Suffolk Ln
- 3005 Moores Rd
- 3006 Charles St
- 2016 Durham Rd
- 2510 Greene Rd
- 2704 Terra Vista Dr
- 1906 Parkwood Dr
- 1913 Trout Farm Rd
- 2431 Baldwin Mill Rd
- 2301 Victorian View Ct
- 2705 Fallston Rd
- 3427 N Furnace Rd
- 1705 Moonriver Ct
- 2033 Packard Dr
- 2106 Schuster Rd
- 3845 Norrisville Rd
- 16131 Old York Rd
- 2319 Cool Woods Ct
Your Personal Tour Guide
Ask me questions while you tour the home.