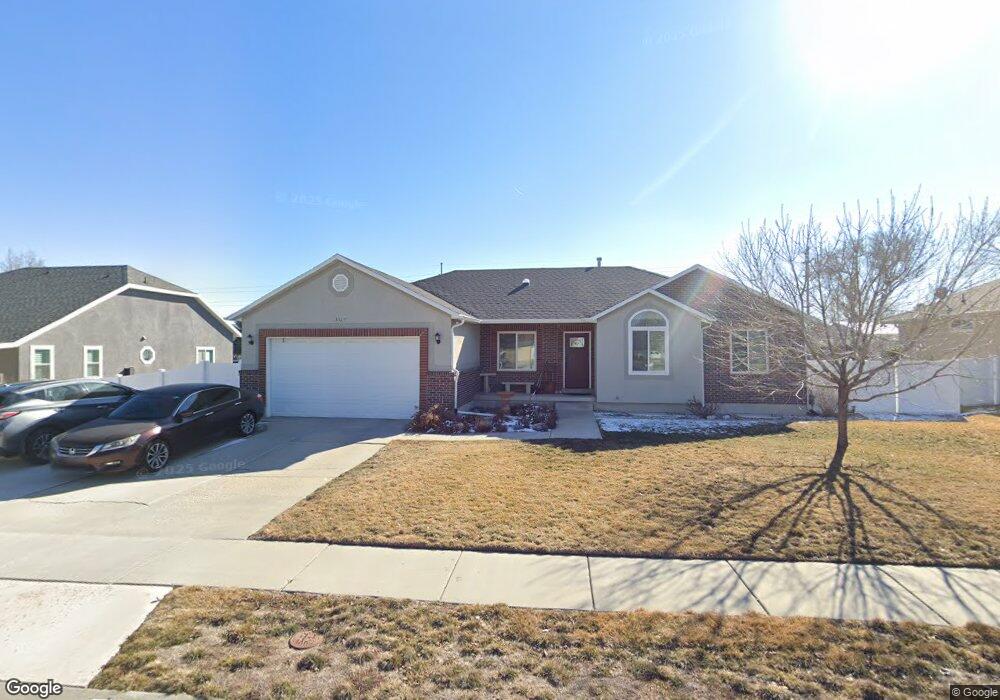
3329 Olive Leaf Ln West Jordan, UT 84088
Edenbrooke NeighborhoodEstimated Value: $623,897 - $654,000
3
Beds
3
Baths
1,527
Sq Ft
$419/Sq Ft
Est. Value
About This Home
This home is located at 3329 Olive Leaf Ln, West Jordan, UT 84088 and is currently estimated at $639,224, approximately $418 per square foot. 3329 Olive Leaf Ln is a home located in Salt Lake County with nearby schools including Westvale Elementary School, Joel P. Jensen Middle School, and West Jordan High School.
Ownership History
Date
Name
Owned For
Owner Type
Purchase Details
Closed on
Mar 4, 2011
Sold by
Beneficial Financial 1 Inc
Bought by
Juarez Yolanda
Current Estimated Value
Home Financials for this Owner
Home Financials are based on the most recent Mortgage that was taken out on this home.
Original Mortgage
$194,930
Outstanding Balance
$132,706
Interest Rate
4.75%
Mortgage Type
FHA
Estimated Equity
$506,518
Purchase Details
Closed on
Dec 8, 2010
Sold by
Pulley Gordan J and Pulley Carla
Bought by
Beneficial Financial 1 Inc
Purchase Details
Closed on
Dec 23, 2004
Sold by
Pulley Jason H
Bought by
Pulley Jason H and Pulley Erica
Home Financials for this Owner
Home Financials are based on the most recent Mortgage that was taken out on this home.
Original Mortgage
$102,850
Interest Rate
5.76%
Mortgage Type
New Conventional
Purchase Details
Closed on
Oct 19, 1999
Sold by
Maxfield Mark A
Bought by
Pulley Melvin J
Create a Home Valuation Report for This Property
The Home Valuation Report is an in-depth analysis detailing your home's value as well as a comparison with similar homes in the area
Home Values in the Area
Average Home Value in this Area
Purchase History
| Date | Buyer | Sale Price | Title Company |
|---|---|---|---|
| Juarez Yolanda | -- | Backman Title Services | |
| Beneficial Financial 1 Inc | $196,208 | Inwest Title Services | |
| Pulley Jason H | -- | First American Title | |
| Pulley Melvin J | -- | -- |
Source: Public Records
Mortgage History
| Date | Status | Borrower | Loan Amount |
|---|---|---|---|
| Open | Juarez Yolanda | $194,930 | |
| Previous Owner | Pulley Jason H | $102,850 |
Source: Public Records
Tax History Compared to Growth
Tax History
| Year | Tax Paid | Tax Assessment Tax Assessment Total Assessment is a certain percentage of the fair market value that is determined by local assessors to be the total taxable value of land and additions on the property. | Land | Improvement |
|---|---|---|---|---|
| 2025 | $3,134 | $607,600 | $150,900 | $456,700 |
| 2024 | $3,134 | $603,000 | $149,400 | $453,600 |
| 2023 | $3,091 | $560,500 | $146,400 | $414,100 |
| 2022 | $3,187 | $568,600 | $143,600 | $425,000 |
| 2021 | $2,694 | $437,500 | $99,000 | $338,500 |
| 2020 | $2,468 | $376,200 | $81,200 | $295,000 |
| 2019 | $2,488 | $371,900 | $81,200 | $290,700 |
| 2018 | $2,328 | $345,100 | $79,000 | $266,100 |
| 2017 | $2,208 | $325,800 | $79,000 | $246,800 |
| 2016 | $2,103 | $291,600 | $79,000 | $212,600 |
| 2015 | $2,099 | $283,700 | $80,500 | $203,200 |
| 2014 | $2,010 | $267,600 | $76,700 | $190,900 |
Source: Public Records
Map
Nearby Homes
- 3214 W Monterey Pine Ln
- 2970 W 8870 S
- 2883 Jana Lee Dr
- 8886 S 2700 W
- 8493 S 3200 W
- 3750 W Bingham Creek Dr
- 8983 S 3860 W
- 8461 S Meadowlark Ln
- 3256 Star Fire Rd
- 2636 W 9110 S
- 4000 W 8400 S Unit 83
- 3112 Green Acre Dr
- 9294 S 2700 W
- 9441 S Newkirk St
- 8407 Meadow Green Way
- 3888 W 8700 S
- 3827 W Country Squire Dr
- 3702 W Angus Dr
- 1967 W 9350 S
- 9178 Lisa Ave
- 8954 Olive Leaf Ct
- 3329 W Olive Leaf Ln
- 3294 Olive Leaf Ct Unit 208
- 8968 Olive Leaf Ct
- 8968 Olive Leaf Ct Unit 213
- 3324 Olive Leaf Ln
- 3324 W Olive Leaf Ln
- 3312 Olive Leaf Ln
- 3308 W 8940 S Unit 207
- 3308 W 8940 S
- 3293 Olive Leaf Ln
- 3344 Olive Leaf Ln
- 3345 W Olive Leaf Ln
- 8967 S Olive Leaf Ct Unit 210
- 8967 S Olive Leaf Ct
- 8967 Olive Leaf Ct
- 3344 W Olive Leaf Ln
- 3324 W 9000 S
- 3294 W 8940 S
- 3294 W Olive Leaf Ln