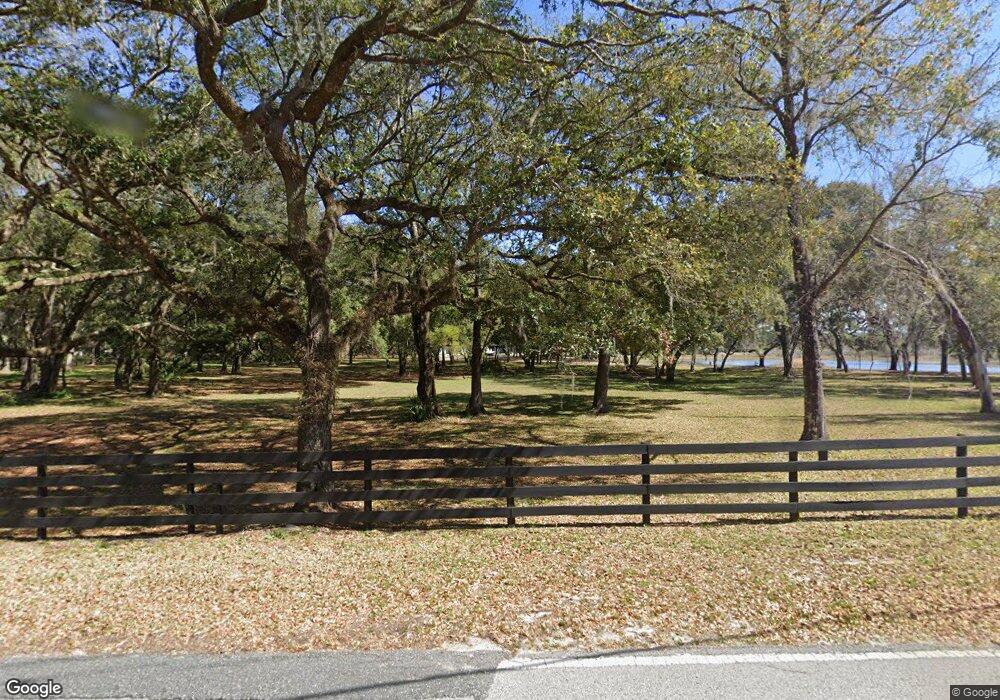
3329 S Canal Rd Inverness, FL 34450
Estimated Value: $655,000 - $783,208
3
Beds
4
Baths
3,297
Sq Ft
$216/Sq Ft
Est. Value
About This Home
This home is located at 3329 S Canal Rd, Inverness, FL 34450 and is currently estimated at $713,552, approximately $216 per square foot. 3329 S Canal Rd is a home located in Citrus County with nearby schools including Inverness Primary School, Inverness Middle School, and Citrus High School.
Ownership History
Date
Name
Owned For
Owner Type
Purchase Details
Closed on
Apr 17, 2024
Sold by
Deline Matthew and Deline Nicole
Bought by
De Line Family Trust and De Line
Current Estimated Value
Purchase Details
Closed on
Feb 14, 2022
Sold by
Morris David P and Morris Dorothy W
Bought by
Deline Matthew and Deline Nicole
Purchase Details
Closed on
Dec 29, 2011
Sold by
Fitzpatrick Adele J and Adele J Fitzpatrick Trust
Bought by
Morris David P and Morris Dorothy W
Home Financials for this Owner
Home Financials are based on the most recent Mortgage that was taken out on this home.
Original Mortgage
$306,000
Interest Rate
3%
Mortgage Type
Adjustable Rate Mortgage/ARM
Purchase Details
Closed on
Mar 19, 2010
Sold by
Fitzpatrick Adele J
Bought by
Fitzpatrick Adele J and The Adele J Fitzpatrick Trust
Purchase Details
Closed on
Mar 1, 2010
Bought by
Morris David P and Morris Dorothy W
Purchase Details
Closed on
Sep 1, 2000
Bought by
Morris David P and Morris Dorothy W
Create a Home Valuation Report for This Property
The Home Valuation Report is an in-depth analysis detailing your home's value as well as a comparison with similar homes in the area
Home Values in the Area
Average Home Value in this Area
Purchase History
| Date | Buyer | Sale Price | Title Company |
|---|---|---|---|
| De Line Family Trust | $100 | None Listed On Document | |
| Deline Matthew | $350,000 | New Title Company Name | |
| Morris David P | $340,000 | Land Title Of Citrus County | |
| Fitzpatrick Adele J | -- | Attorney | |
| Morris David P | $100 | -- | |
| Morris David P | $45,000 | -- |
Source: Public Records
Mortgage History
| Date | Status | Borrower | Loan Amount |
|---|---|---|---|
| Previous Owner | Morris David P | $306,000 |
Source: Public Records
Tax History Compared to Growth
Tax History
| Year | Tax Paid | Tax Assessment Tax Assessment Total Assessment is a certain percentage of the fair market value that is determined by local assessors to be the total taxable value of land and additions on the property. | Land | Improvement |
|---|---|---|---|---|
| 2024 | $8,766 | $587,140 | $58,810 | $528,330 |
| 2023 | $8,766 | $571,672 | $58,810 | $512,862 |
| 2022 | $7,499 | $505,588 | $58,810 | $446,778 |
| 2021 | $3,519 | $272,096 | $0 | $0 |
| 2020 | $3,425 | $373,296 | $58,810 | $314,486 |
| 2019 | $3,387 | $351,261 | $58,810 | $292,451 |
| 2018 | $3,366 | $346,558 | $58,810 | $287,748 |
| 2017 | $3,350 | $251,435 | $61,890 | $189,545 |
| 2016 | $3,399 | $246,263 | $61,890 | $184,373 |
| 2015 | $3,454 | $244,551 | $61,890 | $182,661 |
| 2014 | $3,537 | $242,610 | $57,128 | $185,482 |
Source: Public Records
Map
Nearby Homes
- 3203 S Skyline Dr
- 3341 S Jean Point
- 3231 S Eagle Point
- 3211 S Rose Ave
- 956 Ibis Cir
- 2908 S Skyline Dr
- 3757 S Heron Point
- 3733 S Heron Point
- 1170 S Heron Point
- 1100 S Heron Point
- 1090 S Heron Point
- 1117 S Heron Point
- 3002 S Rose Ave
- 3995 S Reflection Ave
- 3966 S Killdeer Ave
- 3862 S Killdeer Ave
- 3775/3787 S Osprey Point
- 3775 S Osprey Point
- 3986 S Pelican Ave
- 3499 S Stroud Terrace
- 9824 E Regency Row
- 9812 E Regency Row
- 9838 E Regency Row
- 9800 E Regency Row
- 9904 E Regency Row
- 9700 E Regency Row
- 9801 E Regency Row
- 9730 E Regency Row
- 9871 E Sandpiper Dr
- 3346 S Canal Rd
- 9916 E Regency Row
- 9795 E Sandpiper Dr
- 9829 E Regency Row
- 9721 E Regency Row
- 9720 E Seven Lakes Ct
- 9905 E Regency Row
- 9930 E Regency Row
- 3134 S Skyline Dr
- 9711 E Sandpiper Dr
- 3373 S Coffee Point Unit 11