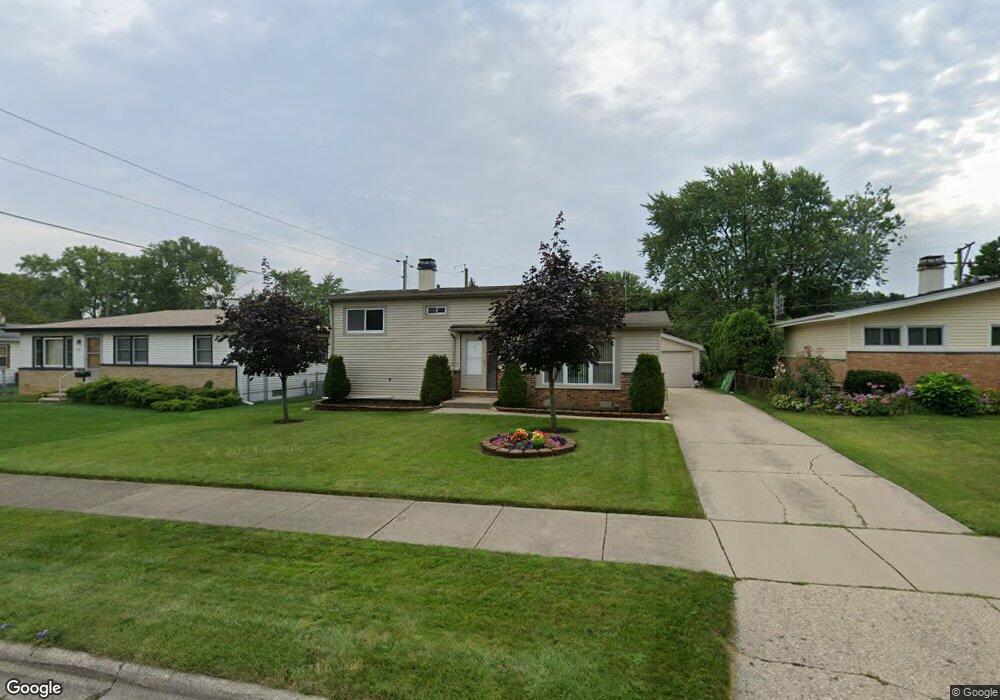
3329 Stonegate Rd Unit 1 Waukegan, IL 60087
Estimated Value: $257,000 - $269,000
3
Beds
2
Baths
960
Sq Ft
$274/Sq Ft
Est. Value
About This Home
This home is located at 3329 Stonegate Rd Unit 1, Waukegan, IL 60087 and is currently estimated at $262,780, approximately $273 per square foot. 3329 Stonegate Rd Unit 1 is a home located in Lake County with nearby schools including H R McCall Elementary School, Jack Benny Middle School, and Waukegan High School.
Ownership History
Date
Name
Owned For
Owner Type
Purchase Details
Closed on
Jan 17, 2011
Sold by
Berg Gerald J
Bought by
Prudential Relocation Inc
Current Estimated Value
Purchase Details
Closed on
May 13, 2010
Sold by
Prudential Relocation Inc
Bought by
Solis Israel and Solis Norma
Home Financials for this Owner
Home Financials are based on the most recent Mortgage that was taken out on this home.
Original Mortgage
$79,100
Interest Rate
4.81%
Mortgage Type
New Conventional
Purchase Details
Closed on
Oct 7, 1994
Sold by
Thompson Harrison and Thompson Dorother
Bought by
Camarillo Berg Gerald J and Camarillo Berg Araceli
Home Financials for this Owner
Home Financials are based on the most recent Mortgage that was taken out on this home.
Original Mortgage
$98,650
Interest Rate
8.64%
Mortgage Type
FHA
Create a Home Valuation Report for This Property
The Home Valuation Report is an in-depth analysis detailing your home's value as well as a comparison with similar homes in the area
Home Values in the Area
Average Home Value in this Area
Purchase History
| Date | Buyer | Sale Price | Title Company |
|---|---|---|---|
| Prudential Relocation Inc | $86,500 | None Available | |
| Solis Israel | $83,500 | Stewart Title Company | |
| Camarillo Berg Gerald J | $99,500 | Ticor Title Insurance Compan |
Source: Public Records
Mortgage History
| Date | Status | Borrower | Loan Amount |
|---|---|---|---|
| Previous Owner | Solis Israel | $79,100 | |
| Previous Owner | Camarillo Berg Gerald J | $98,650 |
Source: Public Records
Tax History Compared to Growth
Tax History
| Year | Tax Paid | Tax Assessment Tax Assessment Total Assessment is a certain percentage of the fair market value that is determined by local assessors to be the total taxable value of land and additions on the property. | Land | Improvement |
|---|---|---|---|---|
| 2024 | $4,445 | $69,887 | $10,494 | $59,393 |
| 2023 | $4,162 | $63,135 | $9,480 | $53,655 |
| 2022 | $4,162 | $53,578 | $8,129 | $45,449 |
| 2021 | $3,729 | $48,772 | $7,741 | $41,031 |
| 2020 | $4,244 | $45,437 | $7,212 | $38,225 |
| 2019 | $4,204 | $41,636 | $6,609 | $35,027 |
| 2018 | $3,527 | $35,761 | $8,503 | $27,258 |
| 2017 | $3,366 | $31,639 | $7,523 | $24,116 |
| 2016 | $3,015 | $27,493 | $6,537 | $20,956 |
| 2015 | $2,805 | $24,607 | $5,851 | $18,756 |
| 2014 | $2,651 | $21,211 | $6,135 | $15,076 |
| 2012 | $3,506 | $22,979 | $6,646 | $16,333 |
Source: Public Records
Map
Nearby Homes
- 3411 N Lewis Ave
- 37966 N Cornell Rd
- 3211 Rugby Ct
- 1636 Rice St
- 1730 W Beach Rd
- 38127 N Shore Ave
- 38362 N Manor Ave
- 3101 Country Club Ln
- 37905 N Loyola Ave
- 38683 N Lewis Ave
- 1612 Whitney St
- 38697 N Cedar Ave
- 2613 N Lewis Ave
- 11345 W Carnahan Ave
- 11342-11364 W Wadsworth Rd
- 12312 W Audrey Ave
- 2350 N Lewis Ave
- 12582 W Beach Rd
- 2708 Dana Ave
- 2705 Dana Ave
- 3333 Stonegate Rd
- 3325 Stonegate Rd
- 3321 Stonegate Rd
- 3337 Stonegate Rd Unit 1
- 3328 N Lewis Ave
- 3332 N Lewis Ave Unit 1
- 3324 N Lewis Ave
- 1901 Edgewood Rd Unit 1
- 3320 N Lewis Ave
- 3328 Stonegate Rd
- 3317 Stonegate Rd Unit 1
- 3324 Stonegate Rd
- 3332 Stonegate Rd
- 3316 N Lewis Ave Unit 1
- 3336 Stonegate Rd
- 3313 Stonegate Rd Unit 1
- 3316 Stonegate Rd
- 3312 N Lewis Ave
- 1904 Edgewood Rd
- 1917 Edgewood Rd