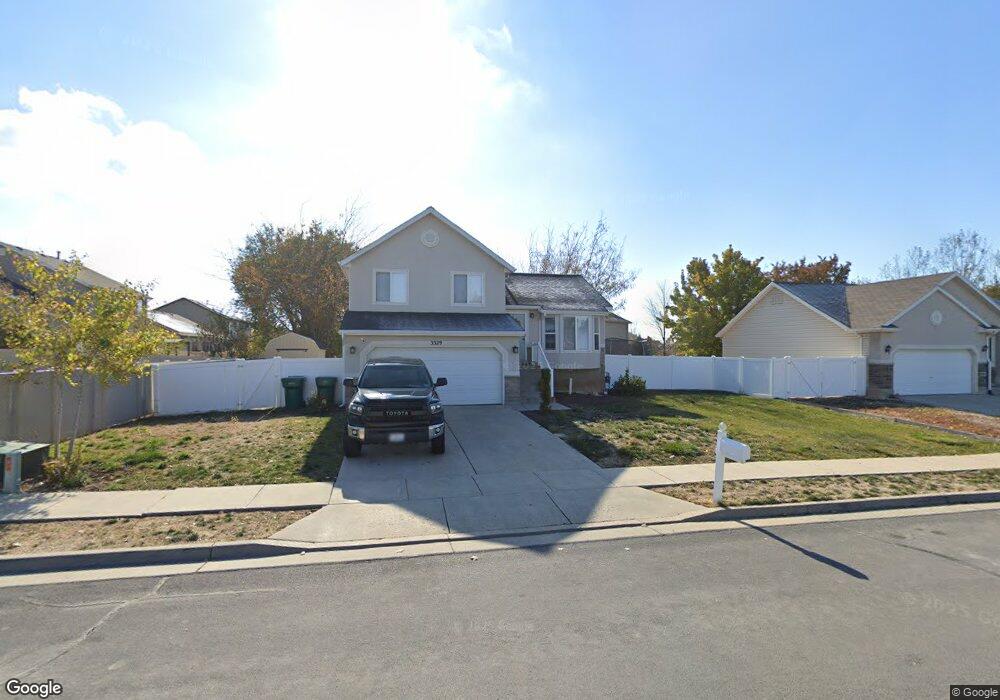
3329 W 1125 N Layton, UT 84041
Estimated Value: $473,763 - $508,000
4
Beds
2
Baths
1,670
Sq Ft
$294/Sq Ft
Est. Value
About This Home
This home is located at 3329 W 1125 N, Layton, UT 84041 and is currently estimated at $491,441, approximately $294 per square foot. 3329 W 1125 N is a home located in Davis County with nearby schools including Sand Springs Elementary School, Legacy Junior High School, and Layton High School.
Ownership History
Date
Name
Owned For
Owner Type
Purchase Details
Closed on
Aug 11, 2020
Sold by
Armstrong Andrew and Armstrong Brittany
Bought by
Marin Osvaldo J and Marin Evelyn L
Current Estimated Value
Home Financials for this Owner
Home Financials are based on the most recent Mortgage that was taken out on this home.
Original Mortgage
$19,087
Outstanding Balance
$16,861
Interest Rate
2.9%
Mortgage Type
Stand Alone Second
Estimated Equity
$474,580
Purchase Details
Closed on
Apr 14, 2008
Sold by
Williams Zachary T and Williams Mayonen
Bought by
Gramse Craig L and Gramse Heather L
Home Financials for this Owner
Home Financials are based on the most recent Mortgage that was taken out on this home.
Original Mortgage
$193,000
Interest Rate
6.22%
Mortgage Type
Purchase Money Mortgage
Purchase Details
Closed on
Mar 27, 2003
Sold by
Gmw Development Inc
Bought by
Williams Zachary T and Williams Mayonen
Home Financials for this Owner
Home Financials are based on the most recent Mortgage that was taken out on this home.
Original Mortgage
$132,914
Interest Rate
5.79%
Mortgage Type
FHA
Create a Home Valuation Report for This Property
The Home Valuation Report is an in-depth analysis detailing your home's value as well as a comparison with similar homes in the area
Home Values in the Area
Average Home Value in this Area
Purchase History
| Date | Buyer | Sale Price | Title Company |
|---|---|---|---|
| Marin Osvaldo J | -- | Inwest Title Services | |
| Gramse Craig L | -- | Equity Title Ins Agency Inc | |
| Williams Zachary T | -- | Bonneville Title Company Inc |
Source: Public Records
Mortgage History
| Date | Status | Borrower | Loan Amount |
|---|---|---|---|
| Open | Marin Osvaldo J | $19,087 | |
| Open | Marin Osvaldo J | $318,131 | |
| Previous Owner | Gramse Craig L | $193,000 | |
| Previous Owner | Williams Zachary T | $132,914 | |
| Closed | Williams Zachary T | $4,050 |
Source: Public Records
Tax History Compared to Growth
Tax History
| Year | Tax Paid | Tax Assessment Tax Assessment Total Assessment is a certain percentage of the fair market value that is determined by local assessors to be the total taxable value of land and additions on the property. | Land | Improvement |
|---|---|---|---|---|
| 2025 | $2,248 | $235,950 | $108,938 | $127,012 |
| 2024 | $2,216 | $234,300 | $120,912 | $113,388 |
| 2023 | $2,114 | $394,000 | $118,831 | $275,169 |
| 2022 | $2,293 | $232,100 | $74,862 | $157,238 |
| 2021 | $0 | $317,000 | $112,323 | $204,677 |
| 2020 | $1,878 | $272,000 | $94,322 | $177,678 |
| 2019 | $1,840 | $261,000 | $97,366 | $163,634 |
| 2018 | $1,657 | $236,000 | $85,331 | $150,669 |
| 2016 | $1,424 | $104,611 | $33,226 | $71,385 |
| 2015 | $1,299 | $90,586 | $33,226 | $57,360 |
| 2014 | $1,282 | $91,380 | $33,226 | $58,154 |
| 2013 | -- | $87,022 | $28,952 | $58,070 |
Source: Public Records
Map
Nearby Homes