
3329 Whitlock Dr N Wilson, NC 27896
About This Home
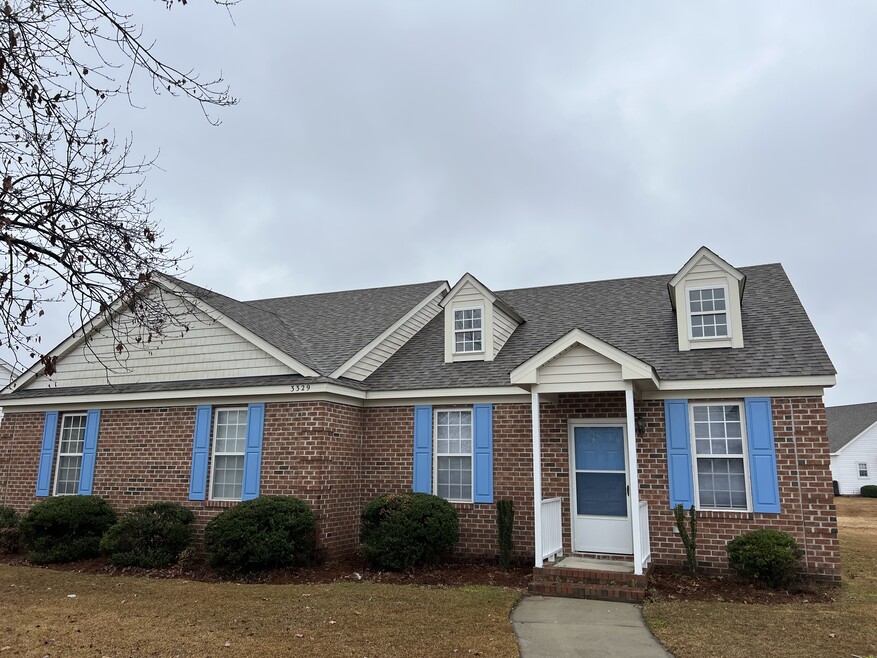
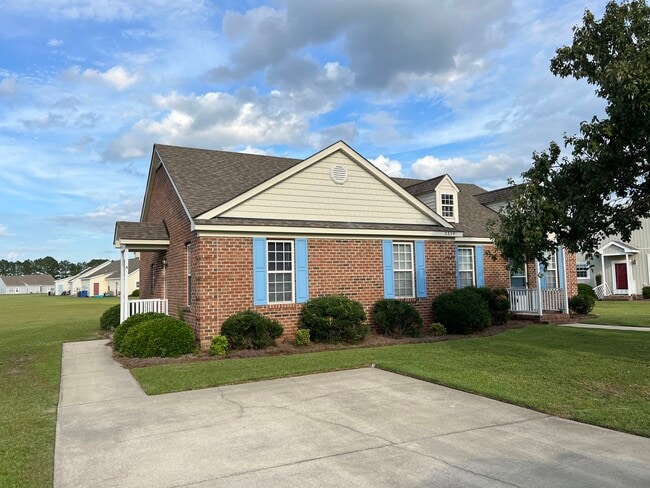
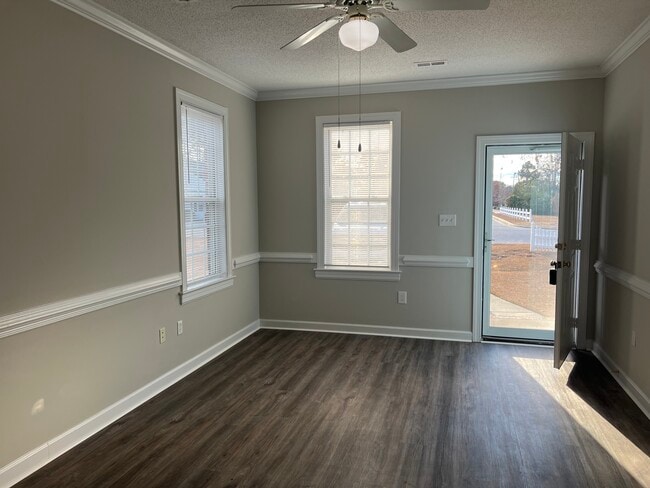
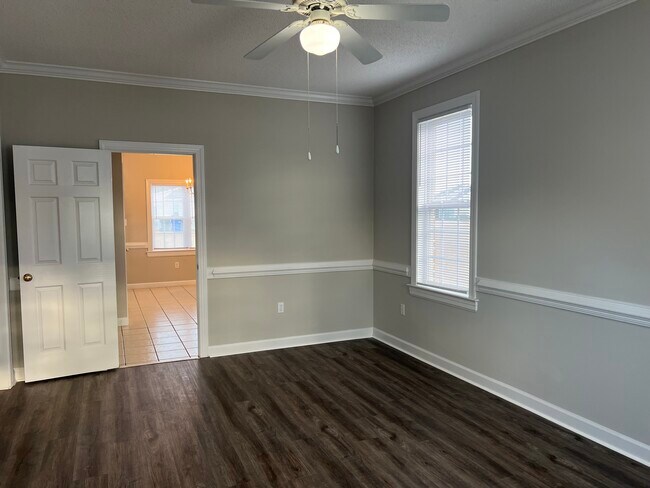
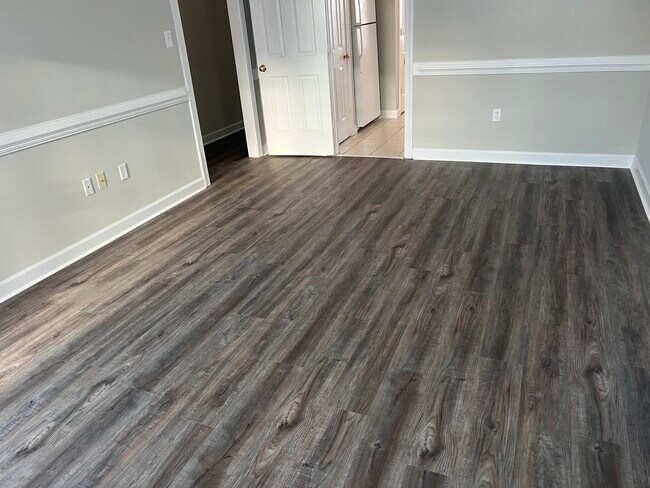
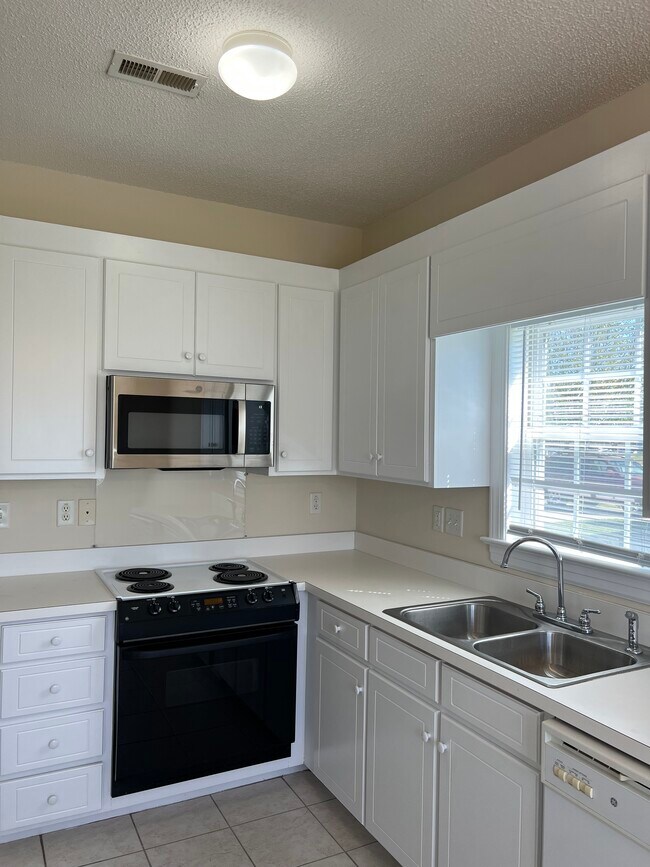
You will feel at home in this serene and private community. Currently, we have available a 2 bedroom duplex apartment for $1,245 per month. These one-story duplex town homes feature unique floor plans, custom cabinetry and tile, carpet and LVP flooring. Appliance amenities include stove, refrigerator and microwave. There is a paved driveway and patio. Also, paved sidewalks circle the entire subdivision. Large sunlit rooms and nine-foot ceilings give these homes a bright and airy feeling. Lawn maintenance is included in the rent. You will be within minutes of several of Wilson's best local restaurants and a short drive to shopping centers and parks. All of these amenities are included in the rent for just $1,245 per month!
Property Features include:
Cable/Internet Ready
All End Units
Blinds
Built-In Microwave
Ceiling Fans
Central Heat/Air
Cabinetry
Dead Bolts
Dishwasher
Eat-in Kitchen**
Enclosed Washer/Dryer HooK-Ups
Exterior Faucets and Electrical Outlets
Front and Rear Entry
Garbage Disposal
Individual Yards
Nine Foot Ceilings
Oven/Range
Pantry
Patio/Deck
Private Driveway
Private Outside Storage
Refrigerator with Ice Maker
Unsurpassed Sound Proofing
Walk-In Closets
Professionally Landscaped
Great Location
Sidewalks
Owner pays for lawn maintenance, electrical/plumbing and heat/ac repairs

Map
- 3103 Welford Place N
- 3645 Eagle Farm Dr N
- 3003 Kings Mill Walk N
- 3902 Redbay Ln
- 2803 Ardsley Rd N
- 3202 Walbrook Place N
- 3806 Wyattwood Dr N
- 2906 Brentwood Dr N
- 2811 Deerfield Ln N
- 3217 Fieldstream Dr N
- 2834 Springflower Dr N
- 4014 Townes Ct
- 2911 Lancaster Rd NW
- 2411 Canal Dr NW
- 2707 Ridge Rd NW
- 2313 Foxcroft Rd NW
- 2311 Foxcroft Rd NW
- 2214 Nash Place N
- 2402 Bradford Dr N Unit 4B
- 2603 Westminster Dr NW
- 3309 Whitlock Dr N
- 2703 Byerly Dr N
- 3911 Hart Ave NW
- 3903 Falcon Ct
- 511 Albert Ave NW Unit PS C
- 1706 Vineyard Dr N
- 4913 Summit Place Dr NW
- 3701 Ashbrook Dr NW
- 1003 Treemont Rd NW
- 1101 Corbett Ave N
- 1003 Branch St NW
- 3761 Raleigh Road Pkwy W
- 100 Dr
- 2050 Airport Blvd NW Unit Nashville
- 2050 Airport Blvd NW Unit Tarboro
- 2050 Airport Blvd NW Unit Smithfield
- 2050 Airport Blvd NW
- 100 Pine St W
- 211 Kenan St W
- 230 Goldsboro St SW