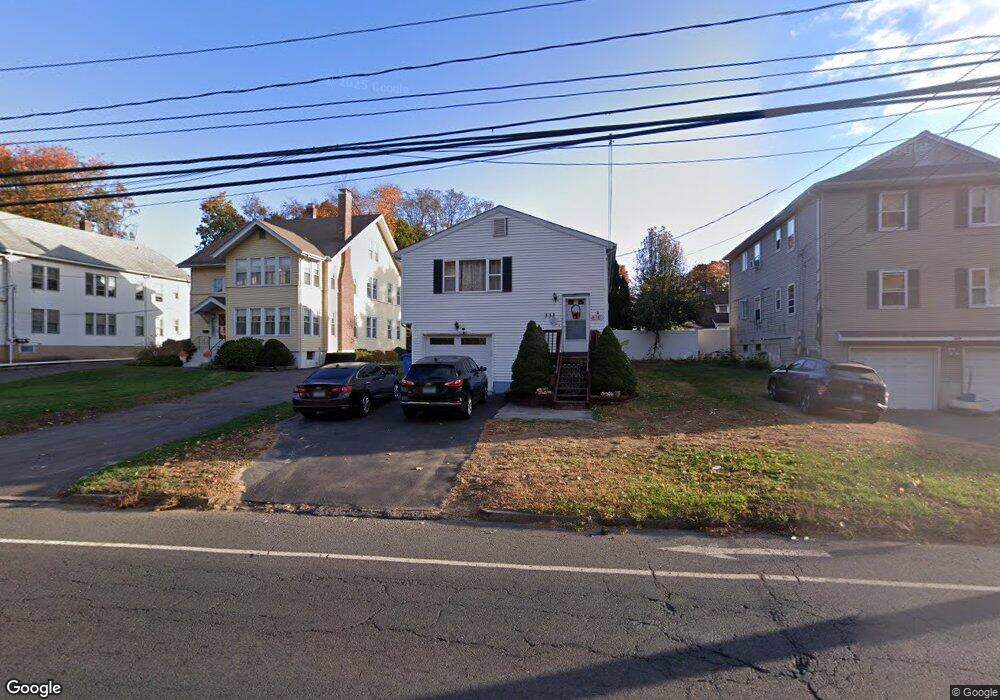
333 Black Rock Ave New Britain, CT 06052
Estimated Value: $298,000 - $366,000
3
Beds
1
Bath
1,934
Sq Ft
$174/Sq Ft
Est. Value
About This Home
This home is located at 333 Black Rock Ave, New Britain, CT 06052 and is currently estimated at $335,767, approximately $173 per square foot. 333 Black Rock Ave is a home located in Hartford County with nearby schools including Lincoln School, Slade Middle School, and Mountain Laurel Sudbury School.
Ownership History
Date
Name
Owned For
Owner Type
Purchase Details
Closed on
Sep 11, 2006
Sold by
Asadorian Edik E
Bought by
Matias Gilmer L and Quispe Roxana G
Current Estimated Value
Home Financials for this Owner
Home Financials are based on the most recent Mortgage that was taken out on this home.
Original Mortgage
$175,000
Outstanding Balance
$102,669
Interest Rate
6.25%
Estimated Equity
$233,098
Purchase Details
Closed on
Sep 29, 2000
Sold by
Dabkowski Debra A
Bought by
Asadorian Edik E
Home Financials for this Owner
Home Financials are based on the most recent Mortgage that was taken out on this home.
Original Mortgage
$108,500
Interest Rate
7.94%
Purchase Details
Closed on
Jun 24, 1992
Sold by
Sirois Gary D and Gutierrez Jorge
Bought by
Mannix Peter S and Mannix Debra
Create a Home Valuation Report for This Property
The Home Valuation Report is an in-depth analysis detailing your home's value as well as a comparison with similar homes in the area
Home Values in the Area
Average Home Value in this Area
Purchase History
| Date | Buyer | Sale Price | Title Company |
|---|---|---|---|
| Matias Gilmer L | $175,000 | -- | |
| Asadorian Edik E | $110,000 | -- | |
| Mannix Peter S | $113,500 | -- |
Source: Public Records
Mortgage History
| Date | Status | Borrower | Loan Amount |
|---|---|---|---|
| Open | Mannix Peter S | $35,233 | |
| Open | Mannix Peter S | $175,000 | |
| Previous Owner | Mannix Peter S | $153,000 | |
| Previous Owner | Mannix Peter S | $108,500 |
Source: Public Records
Tax History Compared to Growth
Tax History
| Year | Tax Paid | Tax Assessment Tax Assessment Total Assessment is a certain percentage of the fair market value that is determined by local assessors to be the total taxable value of land and additions on the property. | Land | Improvement |
|---|---|---|---|---|
| 2025 | $5,935 | $151,480 | $33,460 | $118,020 |
| 2024 | $5,997 | $151,480 | $33,460 | $118,020 |
| 2023 | $5,799 | $151,480 | $33,460 | $118,020 |
| 2022 | $5,416 | $109,410 | $15,400 | $94,010 |
| 2021 | $5,416 | $109,410 | $15,400 | $94,010 |
| 2020 | $5,525 | $109,410 | $15,400 | $94,010 |
| 2019 | $5,525 | $109,410 | $15,400 | $94,010 |
| 2018 | $5,525 | $109,410 | $15,400 | $94,010 |
| 2017 | $5,168 | $102,340 | $14,140 | $88,200 |
| 2016 | $5,168 | $102,340 | $14,140 | $88,200 |
| 2015 | $5,015 | $102,340 | $14,140 | $88,200 |
| 2014 | $5,015 | $102,340 | $14,140 | $88,200 |
Source: Public Records
Map
Nearby Homes
- 71 Pennsylvania Ave
- 96 Garden St
- 149 Pennsylvania Ave Unit 151
- 30 Westerly St
- 817 W Main St
- 43 Westerly St
- 78 Victoria Rd
- 212 Lincoln St
- 112 Lincoln St
- 66 Lincoln St
- 23 Ledyard Rd
- 33 Colt St
- 300 Lincoln St
- 108 Overhill Ave
- 423 Monroe St
- 28 Weigands Dr
- 115 Beechwood Dr
- 256 Hart St
- 1467 Corbin Ave
- 1485 Corbin Ave
- 329 Black Rock Ave
- 339 Black Rock Ave
- 345 Black Rock Ave
- 22 Everett St
- 32 Everett St
- 28 Everett St
- 319 Black Rock Ave
- 18 Everett St
- 311 Black Rock Ave
- 12 Everett St
- 20 New Hampshire Dr Unit 12D
- 20 New Hampshire Dr Unit 11D
- 20 New Hampshire Dr Unit 10D
- 20 New Hampshire Dr Unit 9D
- 20 New Hampshire Dr Unit 8D
- 20 New Hampshire Dr Unit 7D
- 20 New Hampshire Dr Unit 6D
- 20 New Hampshire Dr Unit 5D
- 20 New Hampshire Dr Unit 4D
- 20 New Hampshire Dr Unit 3D