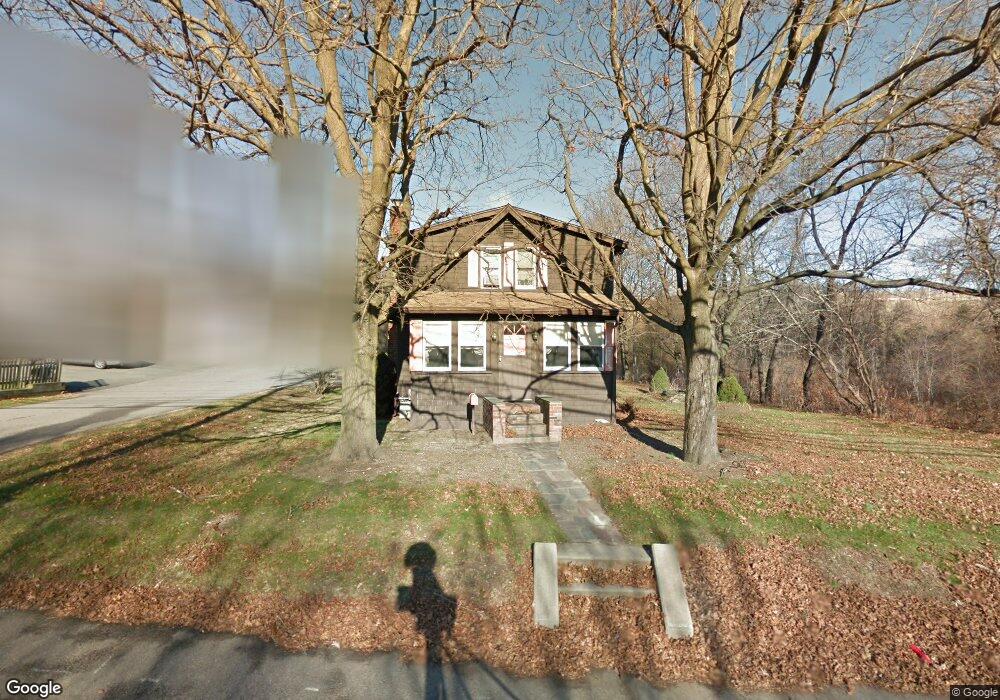
333 Common St Braintree, MA 02184
North Braintree NeighborhoodEstimated Value: $529,000 - $635,000
3
Beds
2
Baths
1,249
Sq Ft
$477/Sq Ft
Est. Value
About This Home
This home is located at 333 Common St, Braintree, MA 02184 and is currently estimated at $595,443, approximately $476 per square foot. 333 Common St is a home located in Norfolk County with nearby schools including Braintree High School, Step Ahead Kindergarten, and Meeting House Montessori School.
Ownership History
Date
Name
Owned For
Owner Type
Purchase Details
Closed on
Apr 26, 2012
Sold by
Pp & Dt Oconnor Ret and Oconnor
Bought by
Oconnor Robert P
Current Estimated Value
Home Financials for this Owner
Home Financials are based on the most recent Mortgage that was taken out on this home.
Original Mortgage
$92,000
Outstanding Balance
$62,861
Interest Rate
3.91%
Mortgage Type
New Conventional
Estimated Equity
$532,582
Create a Home Valuation Report for This Property
The Home Valuation Report is an in-depth analysis detailing your home's value as well as a comparison with similar homes in the area
Home Values in the Area
Average Home Value in this Area
Purchase History
| Date | Buyer | Sale Price | Title Company |
|---|---|---|---|
| Oconnor Robert P | $230,100 | -- |
Source: Public Records
Mortgage History
| Date | Status | Borrower | Loan Amount |
|---|---|---|---|
| Open | Oconnor Robert P | $92,000 |
Source: Public Records
Tax History
| Year | Tax Paid | Tax Assessment Tax Assessment Total Assessment is a certain percentage of the fair market value that is determined by local assessors to be the total taxable value of land and additions on the property. | Land | Improvement |
|---|---|---|---|---|
| 2025 | $5,034 | $504,400 | $270,200 | $234,200 |
| 2024 | $4,622 | $487,600 | $256,500 | $231,100 |
| 2023 | $4,370 | $447,700 | $229,000 | $218,700 |
| 2022 | $4,363 | $438,500 | $219,800 | $218,700 |
| 2021 | $3,968 | $398,800 | $192,400 | $206,400 |
| 2020 | $3,847 | $390,200 | $192,400 | $197,800 |
| 2019 | $3,707 | $367,400 | $183,200 | $184,200 |
| 2018 | $3,600 | $341,600 | $164,900 | $176,700 |
| 2017 | $3,367 | $313,500 | $146,600 | $166,900 |
| 2016 | $3,267 | $297,500 | $137,400 | $160,100 |
| 2015 | $3,172 | $286,500 | $131,900 | $154,600 |
| 2014 | $2,999 | $262,600 | $119,100 | $143,500 |
Source: Public Records
Map
Nearby Homes
- 29 Joseph Rd
- 63 Dickerman Ln
- 87 Walnut St
- 20 Blossom Rd
- 15 Calvin St
- 21 Totman St Unit 205
- 21 Totman St Unit 409
- 21 Totman St Unit 203
- 21 Totman St Unit 403
- 21 Totman St Unit 301
- 21 Totman St Unit 208
- 21 Totman St Unit PH-405
- 21 Totman St Unit PH-401
- 21 Totman St Unit 407
- 21 Totman St Unit 204
- 9 Independence Ave Unit 102
- 9 Independence Ave Unit 307
- 11 Oak Grove Terrace Unit 301
- 47 Addison St
- 51 Branch St Unit 2
Your Personal Tour Guide
Ask me questions while you tour the home.