Estimated Value: $5,063,003 - $6,807,000
1
Bed
--
Bath
900
Sq Ft
$6,777/Sq Ft
Est. Value
About This Home
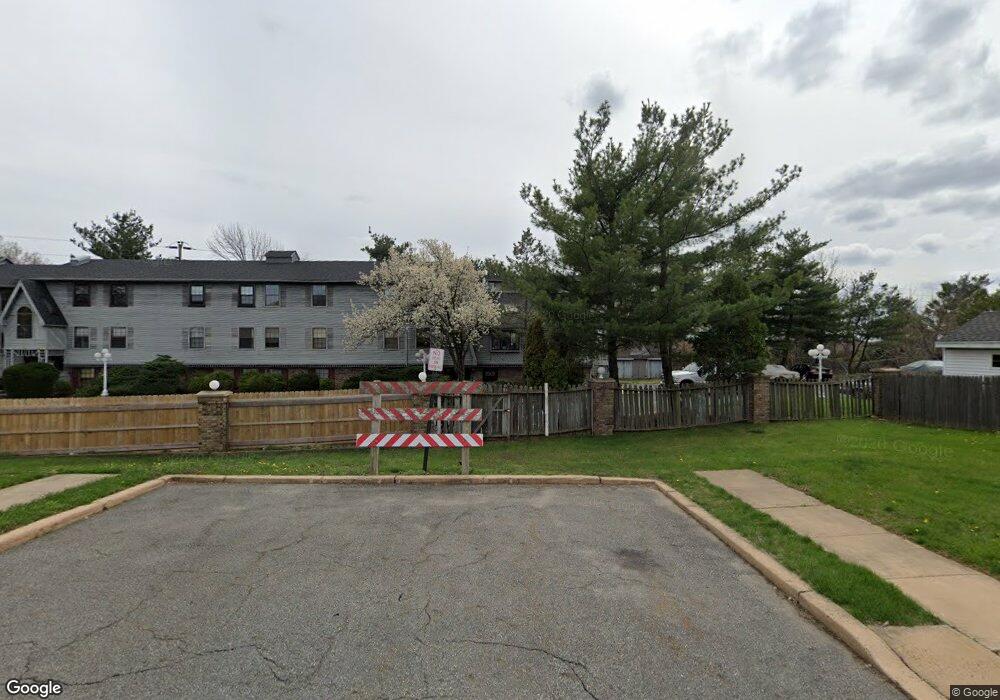
This home is located at 333 Crows Mill Rd, Fords, NJ 08863 and is currently estimated at $6,099,001, approximately $6,776 per square foot. 333 Crows Mill Rd is a home located in Middlesex County with nearby schools including Menlo Park Terrace School, Fords Middle School, and Woodbridge High School.
Ownership History
Date
Name
Owned For
Owner Type
Purchase Details
Closed on
Nov 22, 2017
Sold by
Molnar Eugene S and Berardi Patrica
Bought by
Bluegate Village Lp
Current Estimated Value
Home Financials for this Owner
Home Financials are based on the most recent Mortgage that was taken out on this home.
Original Mortgage
$2,662,500
Outstanding Balance
$2,236,333
Interest Rate
3.94%
Mortgage Type
Purchase Money Mortgage
Estimated Equity
$3,862,668
Purchase Details
Closed on
May 20, 1987
Bought by
Molnar Stephen
Create a Home Valuation Report for This Property
The Home Valuation Report is an in-depth analysis detailing your home's value as well as a comparison with similar homes in the area
Home Values in the Area
Average Home Value in this Area
Purchase History
| Date | Buyer | Sale Price | Title Company |
|---|---|---|---|
| Bluegate Village Lp | $3,550,000 | Riverside Abstract Nj | |
| Molnar Stephen | -- | -- |
Source: Public Records
Mortgage History
| Date | Status | Borrower | Loan Amount |
|---|---|---|---|
| Open | Bluegate Village Lp | $2,662,500 |
Source: Public Records
Tax History
| Year | Tax Paid | Tax Assessment Tax Assessment Total Assessment is a certain percentage of the fair market value that is determined by local assessors to be the total taxable value of land and additions on the property. | Land | Improvement |
|---|---|---|---|---|
| 2025 | $88,808 | $657,300 | $64,300 | $593,000 |
| 2024 | $85,837 | $657,300 | $64,300 | $593,000 |
Source: Public Records
Map
Nearby Homes
- 12 E William St
- 21 Douglas St
- 3 Lillian St
- 101 Saint Stephens Ave
- 12 Liberty St
- 450 Crows Mill Rd
- 1 Olive St
- 40 Ling St
- 25 March Place
- 16 Emmett Ave
- 142 Liberty St
- 179 Liberty St
- 636 King Georges Rd
- 131 Fairfield Ave
- 130 Loretta St
- 163 Winchester Rd
- 27 S 2nd St
- 40 Bensonhurst Ave
- 71 S Maplewood Ave
- 60 Greenbrook Ave
Your Personal Tour Guide
Ask me questions while you tour the home.