333 Cypress St Fall River, MA 02720
Highlands-Fall River NeighborhoodEstimated Value: $408,482 - $502,000
3
Beds
1
Bath
1,469
Sq Ft
$301/Sq Ft
Est. Value
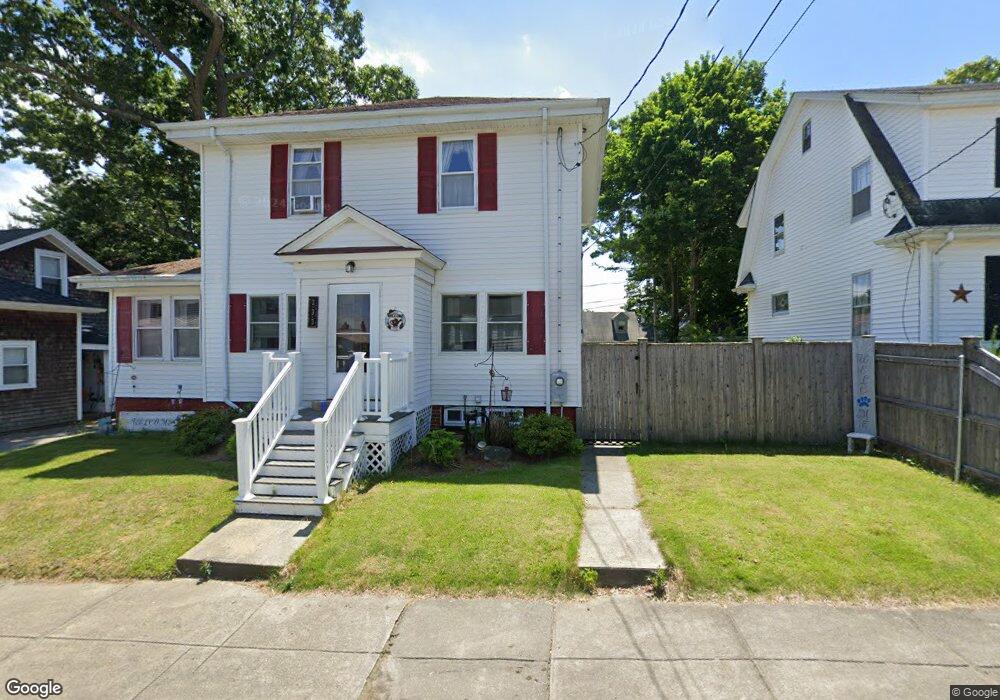
About This Home
This home is located at 333 Cypress St, Fall River, MA 02720 and is currently estimated at $442,871, approximately $301 per square foot. 333 Cypress St is a home located in Bristol County with nearby schools including Spencer Borden Elementary School, Morton Middle School, and B M C Durfee High School.
Ownership History
Date
Name
Owned For
Owner Type
Purchase Details
Closed on
Jul 27, 1992
Sold by
Feldman Masrk J and Feldman Neil J
Bought by
Nowicki Stephanie T
Current Estimated Value
Home Financials for this Owner
Home Financials are based on the most recent Mortgage that was taken out on this home.
Original Mortgage
$75,000
Interest Rate
8.49%
Mortgage Type
Purchase Money Mortgage
Create a Home Valuation Report for This Property
The Home Valuation Report is an in-depth analysis detailing your home's value as well as a comparison with similar homes in the area
Home Values in the Area
Average Home Value in this Area
Purchase History
| Date | Buyer | Sale Price | Title Company |
|---|---|---|---|
| Nowicki Stephanie T | $80,000 | -- |
Source: Public Records
Mortgage History
| Date | Status | Borrower | Loan Amount |
|---|---|---|---|
| Open | Nowicki Stephanie T | $80,000 | |
| Closed | Nowicki Stephanie T | $75,000 |
Source: Public Records
Map
Nearby Homes
- 742 New Boston Rd
- 108 Garden St
- 295 Newbury St
- 25 O'Hearn St
- 677 Oak Grove Ave
- 1231 Robeson St
- 301 Madison St
- 309 Doherty St
- 36 Fordney St
- 27 Kane St
- 65 Bigelow St
- 499 Hanover St
- 45-47 Shawmut St
- 503 Highland Ave
- 545 Robeson St
- 208 Florence St
- 247 Albany St
- 213 Weetamoe St
- 333 Langley St
- 376 N Underwood St
- 323 Cypress St
- 345 Cypress St
- 355 Cypress St
- 313 Cypress St
- 49 Rathgar St
- 334 Cypress St
- 65 Rathgar St
- 352 Cypress St
- 365 Cypress St
- 326 Cypress St
- 326 Cypress St Unit 1
- 298 Cypress St
- 23 Rathgar St
- 318 Cypress St
- 175 Ray St
- 375 Cypress St
- 1307 President Ave
- 190 Chestnut St
- 12 Chestnut St
- 290 Cypress St
Your Personal Tour Guide
Ask me questions while you tour the home.