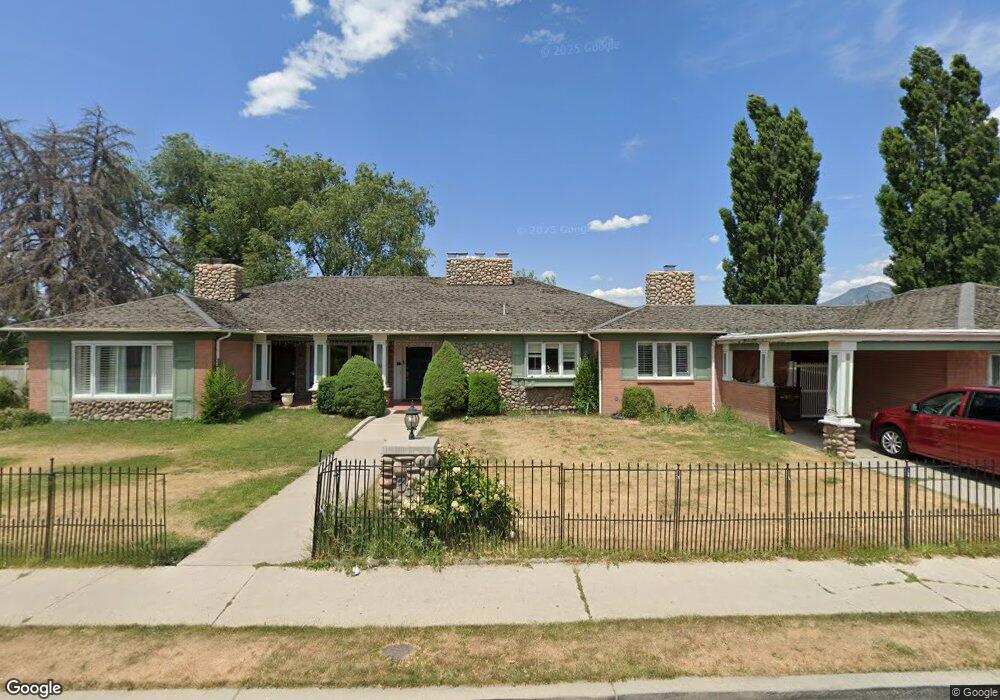
333 E Clark St Salt Lake City, UT 84107
Estimated Value: $1,161,000 - $1,452,066
6
Beds
5
Baths
6,588
Sq Ft
$191/Sq Ft
Est. Value
About This Home
This home is located at 333 E Clark St, Salt Lake City, UT 84107 and is currently estimated at $1,258,517, approximately $191 per square foot. 333 E Clark St is a home located in Salt Lake County with nearby schools including Parkside Elementary School, Hillcrest Junior High School, and Murray High School.
Ownership History
Date
Name
Owned For
Owner Type
Purchase Details
Closed on
Feb 10, 2010
Sold by
Thompson Marshall and Thompson Keri
Bought by
Thompson Samuel Marshall and Thompson Keri A
Current Estimated Value
Home Financials for this Owner
Home Financials are based on the most recent Mortgage that was taken out on this home.
Original Mortgage
$311,000
Outstanding Balance
$206,652
Interest Rate
5.11%
Mortgage Type
New Conventional
Estimated Equity
$1,051,865
Purchase Details
Closed on
Dec 10, 2009
Sold by
Aurora Loan Services Llc
Bought by
Thompson Marshall and Thompson Keri
Purchase Details
Closed on
Oct 16, 2009
Sold by
Acord Michael L
Bought by
Aurora Loan Services Llc
Purchase Details
Closed on
Jul 23, 2007
Sold by
Acord Michael L
Bought by
Acord Michael L and Acord Camille
Home Financials for this Owner
Home Financials are based on the most recent Mortgage that was taken out on this home.
Original Mortgage
$598,500
Interest Rate
6.73%
Mortgage Type
New Conventional
Purchase Details
Closed on
Jul 31, 2006
Sold by
Acord Michael L
Bought by
Acord Michael L and Acord Camille
Home Financials for this Owner
Home Financials are based on the most recent Mortgage that was taken out on this home.
Original Mortgage
$468,000
Interest Rate
6.57%
Mortgage Type
Unknown
Purchase Details
Closed on
Oct 4, 2004
Sold by
Anderton C Ned
Bought by
Hansen Kevin M and Hansen Shannon M
Home Financials for this Owner
Home Financials are based on the most recent Mortgage that was taken out on this home.
Original Mortgage
$431,910
Interest Rate
7.55%
Mortgage Type
Unknown
Purchase Details
Closed on
Sep 23, 2003
Sold by
Bank Of New York
Bought by
Anderton C Ned
Purchase Details
Closed on
Jul 10, 2001
Sold by
Rundgren Georgiana
Bought by
Foulger Gradon K and Foulger Erma Jean
Purchase Details
Closed on
Apr 2, 2001
Sold by
Brinton Evyonna W
Bought by
Rundgren Georgiana
Home Financials for this Owner
Home Financials are based on the most recent Mortgage that was taken out on this home.
Original Mortgage
$382,990
Interest Rate
7.19%
Mortgage Type
Seller Take Back
Purchase Details
Closed on
Apr 11, 1995
Sold by
Wilkinson O Bryan and Noren Susan W
Bought by
Brinton Evyonna W
Home Financials for this Owner
Home Financials are based on the most recent Mortgage that was taken out on this home.
Original Mortgage
$246,050
Interest Rate
8.6%
Create a Home Valuation Report for This Property
The Home Valuation Report is an in-depth analysis detailing your home's value as well as a comparison with similar homes in the area
Home Values in the Area
Average Home Value in this Area
Purchase History
| Date | Buyer | Sale Price | Title Company |
|---|---|---|---|
| Thompson Samuel Marshall | -- | Wasatch Title Ins Agency Llc | |
| Thompson Marshall | -- | Premier Title Ins Agency | |
| Aurora Loan Services Llc | $625,102 | Security Title Ins Agency | |
| Acord Michael L | -- | Accommodation | |
| Acord Michael L | -- | Backman Title Services | |
| Acord Michael L | -- | Backman Title Services | |
| Acord Michael L | -- | Backman Title Services | |
| Hansen Kevin M | -- | Aspen Title Insurance Agency | |
| Anderton C Ned | -- | First American Title | |
| Bank Of New York | -- | First American Title | |
| Foulger Gradon K | -- | -- | |
| Rundgren Georgiana | -- | Equity Title | |
| Brinton Evyonna W | -- | -- |
Source: Public Records
Mortgage History
| Date | Status | Borrower | Loan Amount |
|---|---|---|---|
| Open | Thompson Samuel Marshall | $311,000 | |
| Previous Owner | Acord Michael L | $598,500 | |
| Previous Owner | Acord Michael L | $468,000 | |
| Previous Owner | Hansen Kevin M | $431,910 | |
| Previous Owner | Rundgren Georgiana | $382,990 | |
| Previous Owner | Brinton Evyonna W | $246,050 |
Source: Public Records
Tax History Compared to Growth
Tax History
| Year | Tax Paid | Tax Assessment Tax Assessment Total Assessment is a certain percentage of the fair market value that is determined by local assessors to be the total taxable value of land and additions on the property. | Land | Improvement |
|---|---|---|---|---|
| 2025 | $5,672 | $1,406,000 | $511,300 | $894,700 |
| 2024 | $5,672 | $1,257,900 | $495,500 | $762,400 |
| 2023 | $5,672 | $1,190,800 | $390,200 | $800,600 |
| 2022 | $5,407 | $1,092,000 | $382,600 | $709,400 |
| 2021 | $5,451 | $970,900 | $294,300 | $676,600 |
| 2020 | $5,449 | $918,400 | $286,600 | $631,800 |
| 2019 | $3,900 | $635,100 | $271,100 | $364,000 |
| 2018 | $0 | $600,000 | $271,100 | $328,900 |
| 2017 | $3,530 | $591,300 | $244,700 | $346,600 |
| 2016 | $3,360 | $543,500 | $244,700 | $298,800 |
| 2015 | $3,182 | $467,400 | $308,300 | $159,100 |
| 2014 | $2,868 | $417,900 | $302,500 | $115,400 |
Source: Public Records
Map
Nearby Homes
- 313 Elm St
- 436 Moss Creek Dr
- 496 E Spruce Glen Rd
- 4757 S Meadowview Rd
- 155 E Vine St
- 149 E Vine St
- 700 E Spruce Glen Rd
- 424 Shamrock Dr
- 469 E Vine St
- 4760 S Millrace Ln
- 4600 S Creekview Dr
- 4641 S Rainbow Dr
- 622 Lincoln Place
- 500 E Julep Dr
- 4913 S Naylor Ln Unit 2
- 4913 S Naylor Ln
- 4520 S Julep Dr
- 599 E Savvy Cove S Unit 44
- 725 E Three Fountains Cir Unit 57
- 5130 Caribbean Way
- 333 Clark St
- 4908 Stone Crest Dr
- 4914 Stone Crest Dr
- 4894 S Stone Crest Dr
- 4894 Stone Crest Dr
- 325 Clark St
- 365 Clark St
- 330 Clark St
- 334 Clark St
- 322 E Clark St
- 322 Clark St
- 4878 S Stone Crest Dr
- 376 Cross Creek Ln
- 376 E Cross Creek Ln
- 4878 Stone Crest Dr
- 4856 Glenn St
- 4856 S Glenn St
- 377 Cross Creek Ln
- 4851 S Atwood Blvd
- 4851 Atwood Blvd