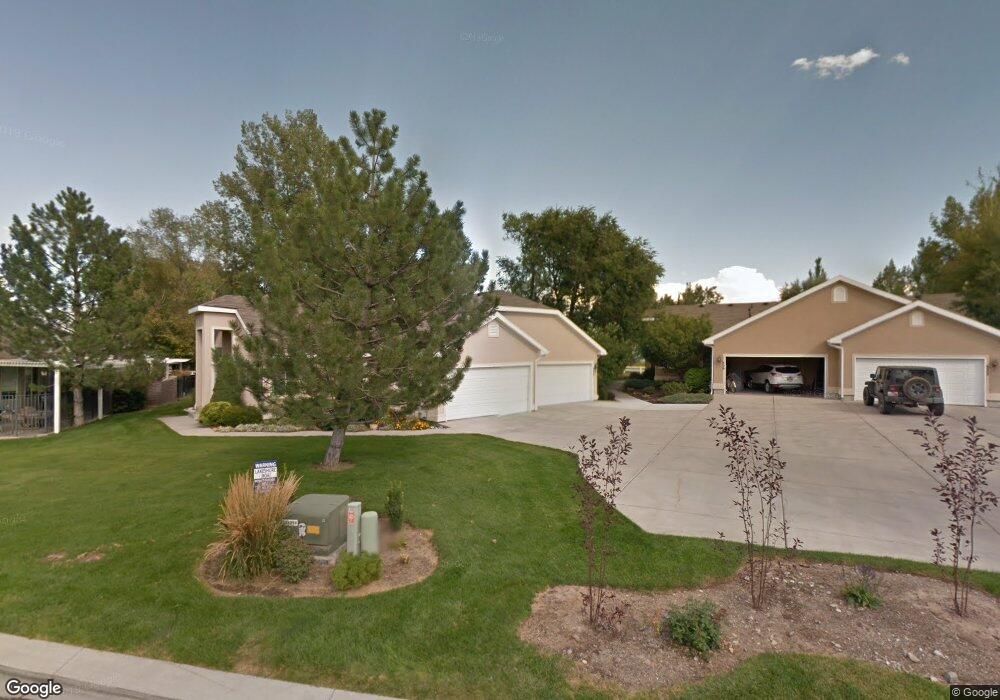
333 E Pavilion Cir Saratoga Springs, UT 84045
Estimated Value: $378,000 - $520,000
2
Beds
3
Baths
2,580
Sq Ft
$177/Sq Ft
Est. Value
About This Home
This home is located at 333 E Pavilion Cir, Saratoga Springs, UT 84045 and is currently estimated at $457,092, approximately $177 per square foot. 333 E Pavilion Cir is a home located in Utah County with nearby schools including Springside Elementary School, Lake Mountain Middle School, and Westlake High School.
Ownership History
Date
Name
Owned For
Owner Type
Purchase Details
Closed on
Jun 28, 2016
Sold by
Thompson Fredrick M and Thompson Sahron R
Bought by
Thomason Frederick M and Thomason Sharon R
Current Estimated Value
Purchase Details
Closed on
Apr 12, 2013
Sold by
White Lynn C and White Leah
Bought by
Thompson Frederick M and Thompson Sharon R
Home Financials for this Owner
Home Financials are based on the most recent Mortgage that was taken out on this home.
Original Mortgage
$205,567
Interest Rate
3.6%
Mortgage Type
New Conventional
Purchase Details
Closed on
Mar 25, 2003
Sold by
White Lynn and White Leah
Bought by
White Lynn C and White Leah
Purchase Details
Closed on
Feb 13, 2002
Sold by
Mortgage Guaranty Insurance Corp
Bought by
White Lynn and White Leah
Purchase Details
Closed on
Jul 16, 2001
Sold by
Carroll Kurt D and Zikes Joan M
Bought by
Macfreddie
Create a Home Valuation Report for This Property
The Home Valuation Report is an in-depth analysis detailing your home's value as well as a comparison with similar homes in the area
Home Values in the Area
Average Home Value in this Area
Purchase History
| Date | Buyer | Sale Price | Title Company |
|---|---|---|---|
| Thomason Frederick M | -- | None Available | |
| Thompson Frederick M | -- | Bartlett Title Insurance Age | |
| White Lynn C | -- | -- | |
| White Lynn | -- | Provo Land Title Company | |
| Macfreddie | $157,900 | First American Title Co |
Source: Public Records
Mortgage History
| Date | Status | Borrower | Loan Amount |
|---|---|---|---|
| Previous Owner | Thompson Frederick M | $205,567 |
Source: Public Records
Tax History Compared to Growth
Tax History
| Year | Tax Paid | Tax Assessment Tax Assessment Total Assessment is a certain percentage of the fair market value that is determined by local assessors to be the total taxable value of land and additions on the property. | Land | Improvement |
|---|---|---|---|---|
| 2025 | $1,854 | $236,940 | $82,700 | $348,100 |
| 2024 | $1,854 | $222,695 | $0 | $0 |
| 2023 | $1,837 | $237,270 | $0 | $0 |
| 2022 | $1,857 | $233,860 | $0 | $0 |
| 2021 | $1,839 | $345,700 | $70,000 | $275,700 |
| 2020 | $1,702 | $314,300 | $70,000 | $244,300 |
| 2019 | $1,616 | $309,000 | $70,000 | $239,000 |
| 2018 | $1,292 | $233,200 | $70,000 | $163,200 |
| 2017 | $1,285 | $124,025 | $0 | $0 |
| 2016 | $1,160 | $103,895 | $0 | $0 |
| 2015 | $1,158 | $98,450 | $0 | $0 |
| 2014 | $1,067 | $89,650 | $0 | $0 |
Source: Public Records
Map
Nearby Homes
- 337 E Pavillion Cir
- 724 S Laguna Cove
- 721 S School House Rd
- 812 S Saratoga Dr
- 519 S Valkyries Ln
- 448 S Pegasus Way
- 874 S Island Rd
- 512 E Meadow Ranch Ln Unit A
- 462 S Iron Shoe Ln Unit B
- 901 S Saratoga Dr
- 122 E Arcade Dr
- 278 E Wren Hill Ln
- 458 S Day Dream Ln
- 51 N Provo River Rd
- 51 N Provo River Rd Unit 265
- 154 E Cove Rd
- 348 S Hayes Well Ln
- 238 E Vista Ct
- 464 S Highpoint Dr
- 324 S Hayes Well Ln
- 333 Pavilion Cir
- 329 E Pavilion Cir
- 337 Pavilion Cir
- 329 Pavilion Cir
- 339 E Pavilion Cir
- 339 E Pavilion Cir Unit 61
- 325 Pavilion Cir
- 339 Pavilion Cir
- 323 Pavilion Cir
- 343 E Pavilion Cir
- 339 E Pavillion Cir
- 323 E Pavilion Cir
- 315 Pavilion Cir
- 319 Pavilion Cir
- 394 Bayside Dr
- 392 E Bayside Dr Unit 32
- 392 Bayside Dr
- 10362 Pavillion Cir
- 10404 Pavillion Cir
- 10409 Pavillion Cir