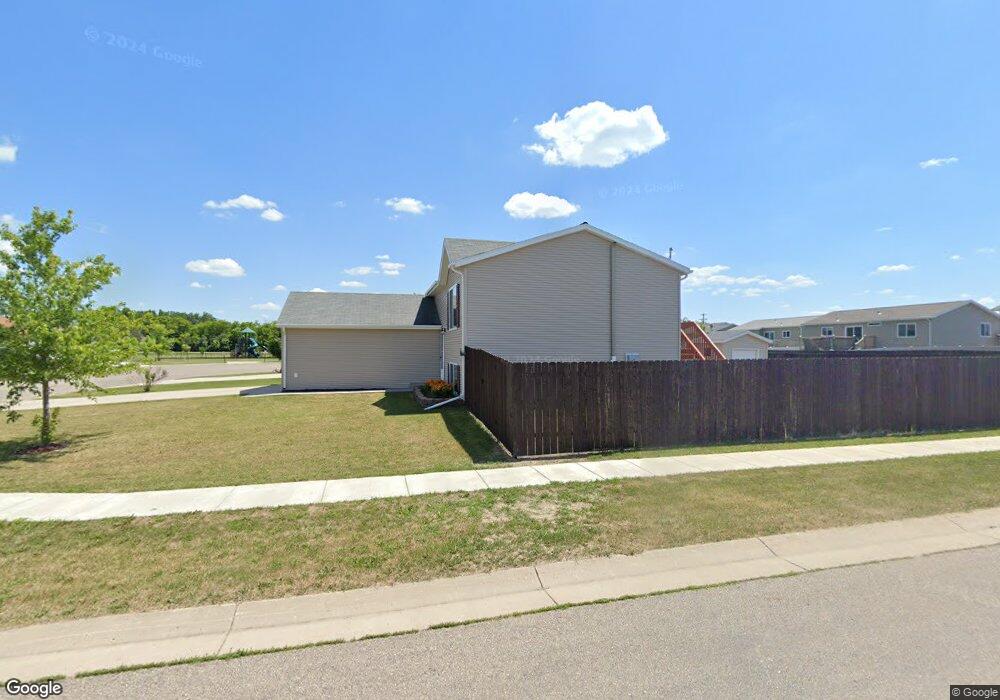
333 Maple Point Blvd Mapleton, ND 58059
Estimated Value: $285,000 - $304,000
4
Beds
2
Baths
1,842
Sq Ft
$160/Sq Ft
Est. Value
About This Home
This home is located at 333 Maple Point Blvd, Mapleton, ND 58059 and is currently estimated at $295,447, approximately $160 per square foot. 333 Maple Point Blvd is a home located in Cass County with nearby schools including Mapleton Elementary School.
Ownership History
Date
Name
Owned For
Owner Type
Purchase Details
Closed on
Aug 26, 2020
Sold by
Offelie Steven and Offelie Steve J
Bought by
Gill Madison and Taylor Joshua
Current Estimated Value
Home Financials for this Owner
Home Financials are based on the most recent Mortgage that was taken out on this home.
Original Mortgage
$203,915
Outstanding Balance
$180,961
Interest Rate
2.9%
Mortgage Type
New Conventional
Estimated Equity
$114,486
Purchase Details
Closed on
Jul 21, 2015
Sold by
Hanson Jason and Hanson Shiloh
Bought by
Oftelie Steve J and Oftelie Chantel
Home Financials for this Owner
Home Financials are based on the most recent Mortgage that was taken out on this home.
Original Mortgage
$190,000
Interest Rate
4.05%
Mortgage Type
New Conventional
Purchase Details
Closed on
Dec 4, 2009
Sold by
Eid Co Buildings Inc
Bought by
Hanson Jason and Hanson Shiloh
Home Financials for this Owner
Home Financials are based on the most recent Mortgage that was taken out on this home.
Original Mortgage
$173,468
Interest Rate
5.11%
Mortgage Type
New Conventional
Create a Home Valuation Report for This Property
The Home Valuation Report is an in-depth analysis detailing your home's value as well as a comparison with similar homes in the area
Purchase History
| Date | Buyer | Sale Price | Title Company |
|---|---|---|---|
| Gill Madison | $223,915 | The Title Co | |
| Oftelie Steve J | $200,000 | Trn Abstract And Title | |
| Hanson Jason | -- | -- |
Source: Public Records
Mortgage History
| Date | Status | Borrower | Loan Amount |
|---|---|---|---|
| Open | Gill Madison | $203,915 | |
| Previous Owner | Oftelie Steve J | $190,000 | |
| Previous Owner | Hanson Jason | $173,468 |
Source: Public Records
Tax History
| Year | Tax Paid | Tax Assessment Tax Assessment Total Assessment is a certain percentage of the fair market value that is determined by local assessors to be the total taxable value of land and additions on the property. | Land | Improvement |
|---|---|---|---|---|
| 2024 | $3,737 | $120,450 | $22,050 | $98,400 |
| 2023 | $4,177 | $120,500 | $22,050 | $98,450 |
| 2022 | $2,989 | $110,800 | $22,050 | $88,750 |
| 2021 | $2,754 | $97,950 | $14,200 | $83,750 |
| 2020 | $2,848 | $95,600 | $14,200 | $81,400 |
| 2019 | $2,878 | $95,600 | $14,200 | $81,400 |
| 2018 | $2,919 | $95,600 | $14,200 | $81,400 |
| 2017 | $2,694 | $94,600 | $14,200 | $80,400 |
| 2016 | $2,005 | $87,950 | $21,400 | $66,550 |
| 2015 | $1,807 | $81,400 | $19,800 | $61,600 |
| 2014 | $1,736 | $74,000 | $18,000 | $56,000 |
| 2013 | $1,773 | $74,000 | $18,000 | $56,000 |
Source: Public Records
Map
Nearby Homes
- 335 Maple Point Blvd
- 233 Maple Point Blvd
- 337 Maple Point Blvd
- 231 Maple Point Blvd
- 338 Maple Point Blvd
- 236 Maple Point Blvd
- 340 Maple Point Blvd
- 349 Maple Point Blvd
- 234 Maple Point Blvd
- 347 Maple Point Blvd
- 229 Maple Point Blvd
- 342 Maple Point Blvd
- 345 Maple Point Blvd
- 232 Maple Point Blvd
- 344 Maple Point Blvd
- 227 Maple Point Blvd
- 339 Maple Point Blvd
- 230 Maple Point Blvd
- 343 Maple Point Blvd
- 228 Maple Point Blvd
Your Personal Tour Guide
Ask me questions while you tour the home.