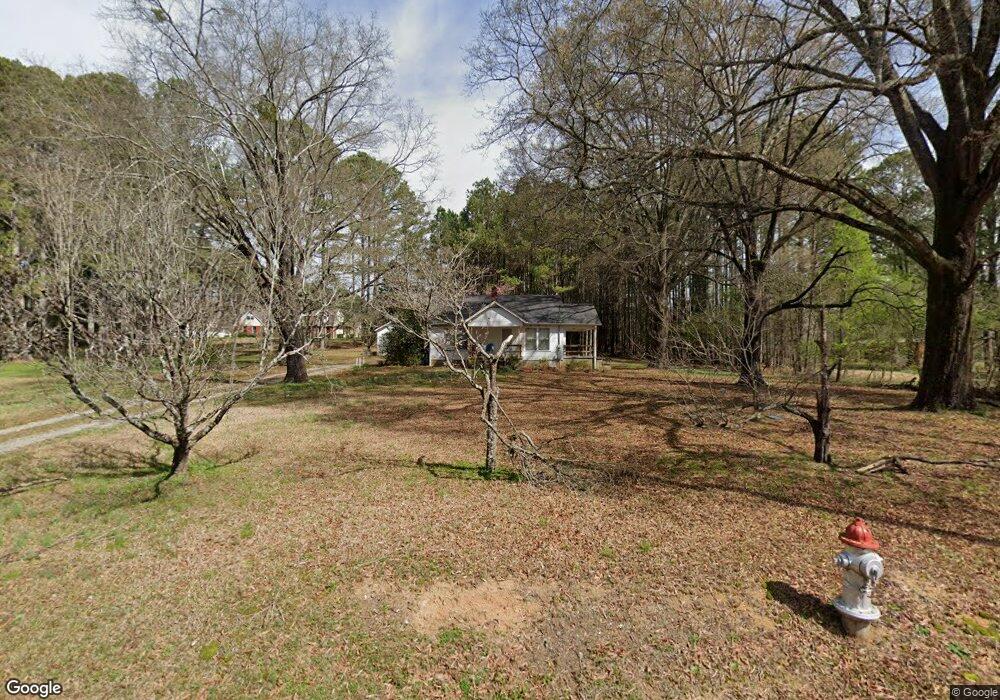
333 McCarter Rd La Fayette, GA 30728
Estimated Value: $175,755 - $296,000
--
Bed
1
Bath
1,232
Sq Ft
$184/Sq Ft
Est. Value
About This Home
This home is located at 333 McCarter Rd, La Fayette, GA 30728 and is currently estimated at $226,189, approximately $183 per square foot. 333 McCarter Rd is a home located in Walker County with nearby schools including North Lafayette Elementary School, Lafayette Middle School, and Lafayette High School.
Ownership History
Date
Name
Owned For
Owner Type
Purchase Details
Closed on
Aug 29, 2012
Sold by
Fuller Paige Moore
Bought by
P & 3 J Moores Fam Investme
Current Estimated Value
Purchase Details
Closed on
Aug 17, 2012
Sold by
Moore Jeremy Joseph
Bought by
Fuller Paige Moore and Moore Jacob Allen
Purchase Details
Closed on
Jan 26, 2000
Sold by
Gray Pearl Evelyn Gilbreath
Bought by
Moore Karen T
Purchase Details
Closed on
Nov 4, 1992
Sold by
Gray Pearl Evelyn Gilbreath
Bought by
Gray Pearl Evelyn Gilbreath
Purchase Details
Closed on
Jul 4, 1983
Sold by
Moore Joe T and Moore Karen T
Bought by
Gray Pearl Evelyn Gilbreath
Purchase Details
Closed on
Jan 1, 1972
Bought by
Gray John
Purchase Details
Closed on
May 22, 1971
Sold by
Gray John
Bought by
Moore Joe T and Moore Karen T
Create a Home Valuation Report for This Property
The Home Valuation Report is an in-depth analysis detailing your home's value as well as a comparison with similar homes in the area
Home Values in the Area
Average Home Value in this Area
Purchase History
| Date | Buyer | Sale Price | Title Company |
|---|---|---|---|
| P & 3 J Moores Fam Investme | -- | -- | |
| Fuller Paige Moore | -- | -- | |
| Moore Karen T | -- | -- | |
| Gray Pearl Evelyn Gilbreath | -- | -- | |
| Gray Pearl Evelyn Gilbreath | $20,000 | -- | |
| Gray Pearl Evelyn Gilbreath | -- | -- | |
| Gray John | -- | -- | |
| Moore Joe T | -- | -- |
Source: Public Records
Tax History Compared to Growth
Tax History
| Year | Tax Paid | Tax Assessment Tax Assessment Total Assessment is a certain percentage of the fair market value that is determined by local assessors to be the total taxable value of land and additions on the property. | Land | Improvement |
|---|---|---|---|---|
| 2024 | $1,305 | $55,786 | $6,000 | $49,786 |
| 2023 | $1,271 | $53,060 | $6,000 | $47,060 |
| 2022 | $1,150 | $44,187 | $4,000 | $40,187 |
| 2021 | $908 | $30,527 | $4,000 | $26,527 |
| 2020 | $786 | $24,823 | $4,000 | $20,823 |
| 2019 | $799 | $24,823 | $4,000 | $20,823 |
| 2018 | $657 | $24,823 | $4,000 | $20,823 |
| 2017 | $868 | $24,863 | $4,040 | $20,823 |
| 2016 | $738 | $24,863 | $4,040 | $20,823 |
| 2015 | $764 | $24,331 | $5,720 | $18,611 |
| 2014 | $679 | $24,331 | $5,720 | $18,611 |
| 2013 | -- | $24,331 | $5,720 | $18,611 |
Source: Public Records
Map
Nearby Homes
- 71 McCarter Rd
- 0 N Highway 27 Unit RTC2680391
- 0 N Highway 27 Unit 1395752
- 474 Lake Howard Rd
- 3032 Lake Howard Rd
- 1520 N Main St
- 10 Acres S Maddox Gap Rd
- 105 Stanfield Rd
- 1403 N Main St
- 197 Old Warren School Rd
- 217 Old Warren School Rd
- 232 Gordon Pond Rd
- 239 Old Warren School Rd
- 253 Old Warren School Rd
- 164 Old Warren School Rd
- 154 Old Warren School Rd
- 144 Old Warren School Rd
- 0 E Warren Rd Unit RTC2681365
- 0 E Warren Rd Unit 1395828
- 393 Wisteria Rd
- 381 McCarter Rd
- 289 McCarter Rd
- 431 McCarter Rd
- 467 McCarter Rd
- 259 Clements Cove
- 392 McCarter Rd
- 65 Old Burton Rd
- 357 McCarter Rd
- 235 McCarter Rd
- 436 McCarter Rd
- 491 McCarter Rd
- 95 Old Burton Rd
- 175 Ramage Ave
- 204 Clements Cove Ln
- 204 Clements Cove
- 151 Old Burton Rd
- 269 Ramage Ave
- 171 Clements Cove Ln Unit A & B
- 171 Clements Cove Ln Unit 1
- 171 Clements Cove Ln