Estimated Value: $255,000 - $388,000
3
Beds
2
Baths
1,886
Sq Ft
$167/Sq Ft
Est. Value
About This Home
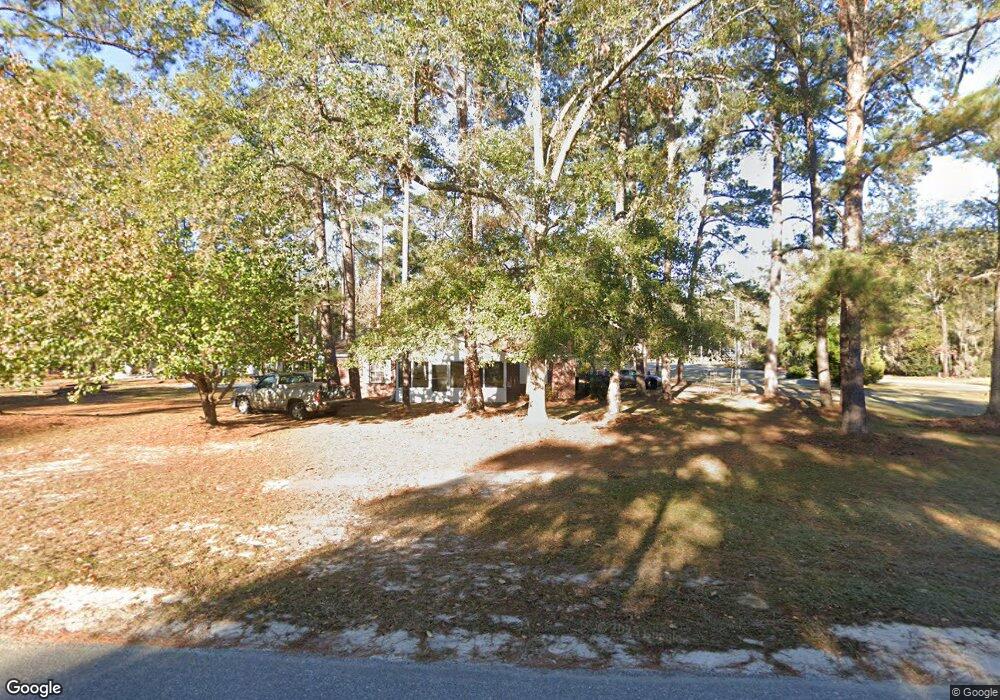
This home is located at 333 Morgan Cemetery Rd Unit 1, Clyo, GA 31303 and is currently estimated at $314,331, approximately $166 per square foot. 333 Morgan Cemetery Rd Unit 1 is a home located in Effingham County with nearby schools including Springfield Elementary School, Effingham County Middle School, and Effingham County High School.
Ownership History
Date
Name
Owned For
Owner Type
Purchase Details
Closed on
Oct 18, 2019
Sold by
Secretary Of Veterans Affairs
Bought by
Hampton Weston M
Current Estimated Value
Home Financials for this Owner
Home Financials are based on the most recent Mortgage that was taken out on this home.
Original Mortgage
$126,161
Outstanding Balance
$110,972
Interest Rate
3.7%
Mortgage Type
New Conventional
Estimated Equity
$203,359
Purchase Details
Closed on
May 7, 2019
Sold by
Pennymac Loan Svcs Llc
Bought by
Secretary Of Veterans Affairs
Purchase Details
Closed on
Apr 10, 2017
Sold by
Aubrey V Estate
Bought by
Carroll Jordan D and Carroll Jocelyn
Home Financials for this Owner
Home Financials are based on the most recent Mortgage that was taken out on this home.
Original Mortgage
$149,139
Interest Rate
4.21%
Mortgage Type
VA
Purchase Details
Closed on
Oct 24, 2003
Bought by
Sutton Aubrey V
Create a Home Valuation Report for This Property
The Home Valuation Report is an in-depth analysis detailing your home's value as well as a comparison with similar homes in the area
Home Values in the Area
Average Home Value in this Area
Purchase History
| Date | Buyer | Sale Price | Title Company |
|---|---|---|---|
| Hampton Weston M | $124,900 | -- | |
| Secretary Of Veterans Affairs | $111,787 | -- | |
| Pennymac Loan Svcs Llc | $111,787 | -- | |
| Carroll Jordan D | $146,000 | -- | |
| Sutton Aubrey V | $105,000 | -- |
Source: Public Records
Mortgage History
| Date | Status | Borrower | Loan Amount |
|---|---|---|---|
| Open | Hampton Weston M | $126,161 | |
| Previous Owner | Carroll Jordan D | $149,139 |
Source: Public Records
Tax History Compared to Growth
Tax History
| Year | Tax Paid | Tax Assessment Tax Assessment Total Assessment is a certain percentage of the fair market value that is determined by local assessors to be the total taxable value of land and additions on the property. | Land | Improvement |
|---|---|---|---|---|
| 2024 | $2,024 | $73,035 | $13,328 | $59,707 |
| 2023 | $1,447 | $72,738 | $13,328 | $59,410 |
| 2022 | $1,926 | $62,664 | $10,472 | $52,192 |
| 2021 | $1,873 | $55,759 | $5,712 | $50,047 |
| 2020 | $1,721 | $48,564 | $2,514 | $46,050 |
| 2019 | $1,836 | $52,293 | $2,929 | $49,364 |
| 2018 | $2,040 | $58,579 | $12,881 | $45,698 |
| 2017 | $1,343 | $52,407 | $8,739 | $43,668 |
| 2016 | $1,246 | $50,698 | $6,117 | $44,581 |
| 2015 | $1,198 | $49,425 | $6,117 | $43,308 |
| 2014 | $1,206 | $49,426 | $6,117 | $43,308 |
| 2013 | -- | $49,425 | $6,117 | $43,308 |
Source: Public Records
Map
Nearby Homes
- 239 Morgan Cemetery Rd
- 282 Tuckasee-King Rd
- 554 Mariners Way
- 1383 Reedsville Rd
- 1382 Reedsville Rd
- 1270 Reedsville Rd
- 0 Reedsville Rd Unit SA336727
- 0 Reedsville Rd Unit Lot 2 SA335653
- 0 Reedsville Rd Unit LOT 2 10575823
- 0 Reedsville Rd Unit SA333786
- 0 Reedsville Rd Unit 10556762
- Tbd Stokes Bluff Landing
- 532 Stokes Bluff Rd
- 0 Stokes Bluff Rd
- 17886 Old Orangeburg Rd
- 0 Morgan Cemetery Rd Unit 21693641
- 0 Reidsville Rd Unit 10397939
- 0 Morgan Cemetery Rd Unit 10393176
- 3481 Sand Hills Rd
- 1488 Old Augusta Rd
- 333 Morgan Cemetery Rd
- 385 Morgan Cemetery Rd
- 385 Morgan Cemetery Rd Unit 2
- 313 Morgan Cemetery Rd
- 372 Morgan Cemetery Rd
- 401 Morgan Cemetery Rd
- 413 Tuckasee King Rd
- 417 Morgan Cemetery Rd
- 291 Morgan Cemetery Rd
- 416 Morgan Cemetery Rd
- 416 Morgan Cemetery Rd
- 402 Morgan Cemetery Rd
- 429 Morgan Cemetery Rd
- 280 Morgan Cemetery Rd
- 432 Morgan Cemetery Rd
- 355 Tuckasee King Rd
- 271 Morgan Cemetery Rd
- 360 Tuckasee King Rd
- 446 Morgan Cemetery Rd
- 273 Morgan Cemetery Rd