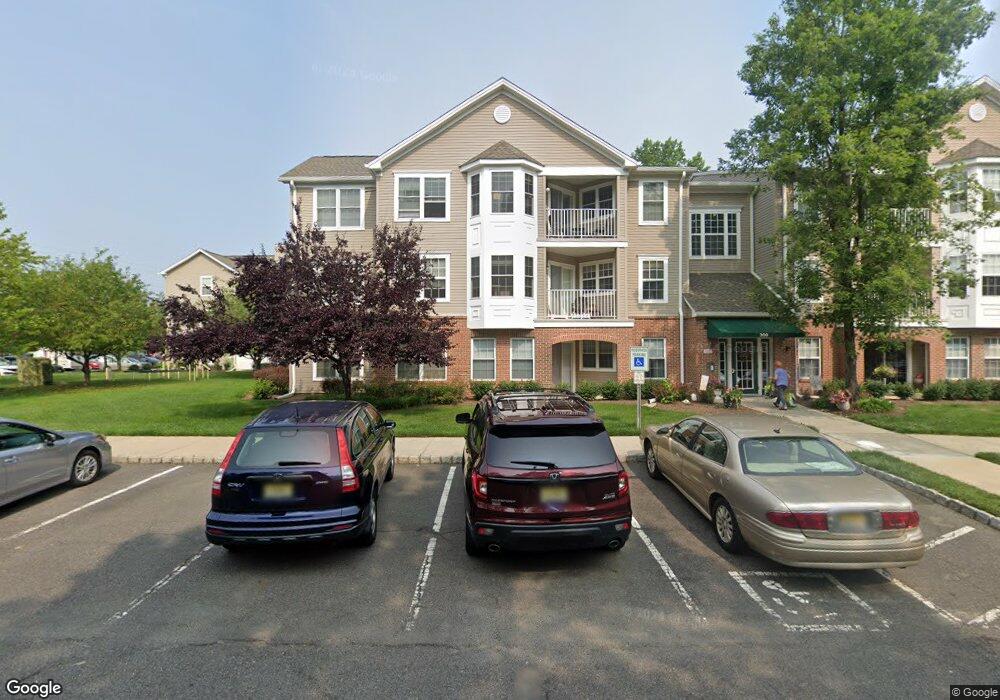
333 Mowat Cir Unit 3 Trenton, NJ 08690
Estimated Value: $313,000 - $323,000
2
Beds
2
Baths
1,275
Sq Ft
$249/Sq Ft
Est. Value
About This Home
This home is located at 333 Mowat Cir Unit 3, Trenton, NJ 08690 and is currently estimated at $317,539, approximately $249 per square foot. 333 Mowat Cir Unit 3 is a home located in Mercer County with nearby schools including Robinson Elementary School, Albert E. Grice Middle School, and Hamilton West-Watson High School.
Ownership History
Date
Name
Owned For
Owner Type
Purchase Details
Closed on
Jun 17, 2013
Sold by
Bracco Michele
Bought by
Cruz Felix
Current Estimated Value
Home Financials for this Owner
Home Financials are based on the most recent Mortgage that was taken out on this home.
Original Mortgage
$135,000
Outstanding Balance
$97,471
Interest Rate
3.83%
Mortgage Type
New Conventional
Estimated Equity
$220,068
Purchase Details
Closed on
Feb 6, 2012
Sold by
Donza Jeanette and Bracco Michele
Bought by
Bracco Michele
Purchase Details
Closed on
Apr 28, 2011
Sold by
Donza Jeanette
Bought by
Donza Jeanette and Bracco Michele
Purchase Details
Closed on
Jul 15, 2010
Sold by
Vanfossen Kathleen A
Bought by
Donza Jeanette
Purchase Details
Closed on
Jan 12, 2001
Sold by
Beazer Homes Corp
Bought by
Vanfossen Kathleen
Create a Home Valuation Report for This Property
The Home Valuation Report is an in-depth analysis detailing your home's value as well as a comparison with similar homes in the area
Home Values in the Area
Average Home Value in this Area
Purchase History
| Date | Buyer | Sale Price | Title Company |
|---|---|---|---|
| Cruz Felix | $150,000 | Empire Title & Abstract Agen | |
| Bracco Michele | -- | None Available | |
| Donza Jeanette | -- | None Available | |
| Donza Jeanette | $177,500 | General Abstract & Title Age | |
| Vanfossen Kathleen | $127,360 | -- |
Source: Public Records
Mortgage History
| Date | Status | Borrower | Loan Amount |
|---|---|---|---|
| Open | Cruz Felix | $135,000 |
Source: Public Records
Tax History Compared to Growth
Tax History
| Year | Tax Paid | Tax Assessment Tax Assessment Total Assessment is a certain percentage of the fair market value that is determined by local assessors to be the total taxable value of land and additions on the property. | Land | Improvement |
|---|---|---|---|---|
| 2025 | $5,466 | $155,100 | $40,000 | $115,100 |
| 2024 | $5,123 | $155,100 | $40,000 | $115,100 |
| 2023 | $5,123 | $155,100 | $40,000 | $115,100 |
| 2022 | $5,042 | $155,100 | $40,000 | $115,100 |
| 2021 | $5,418 | $155,100 | $40,000 | $115,100 |
| 2020 | $4,859 | $155,100 | $40,000 | $115,100 |
| 2019 | $4,754 | $155,100 | $40,000 | $115,100 |
| 2018 | $4,712 | $155,100 | $40,000 | $115,100 |
| 2017 | $4,594 | $155,100 | $40,000 | $115,100 |
| 2016 | $4,194 | $155,100 | $40,000 | $115,100 |
| 2015 | $4,379 | $94,400 | $22,500 | $71,900 |
Source: Public Records
Map
Nearby Homes
- 513 Mowat Cir
- 120 Kingston Blvd
- 109 Burholme Dr
- 37 Willow Bend Dr
- 3 Country Ln
- 147 Burholme Dr
- 60 Kay Chiarello Way
- 52 Kay Chiarello Way
- 48 Kay Chiarello Way
- 46 Kay Chiarello Way
- 44 Kay Chiarello Way
- 42 Kay Chiarello Way
- 40 Kay Chiarello Way
- 193 Burholme Dr
- 38 Kay Chiarello Way
- Asti Plan at Vintage at Hamilton
- 5 Sportsman Blvd
- Chianti Plan at Vintage at Hamilton
- Barolo Plan at Vintage at Hamilton
- Dolcetto Plan at Vintage at Hamilton