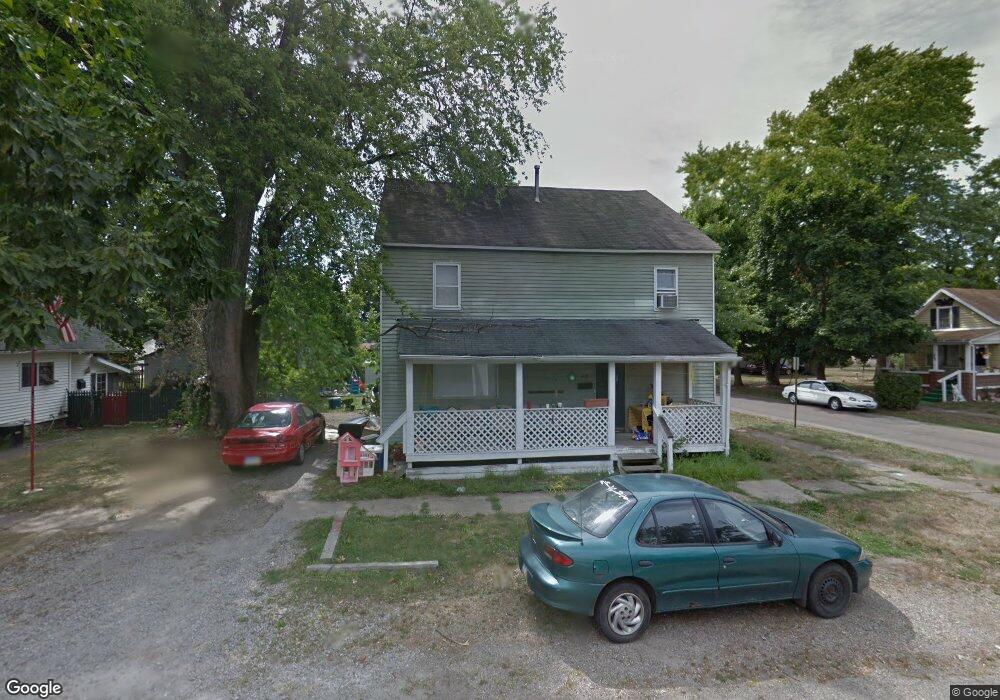
333 N 12th St Coshocton, OH 43812
Estimated Value: $71,000 - $131,000
6
Beds
2
Baths
2,100
Sq Ft
$49/Sq Ft
Est. Value
About This Home
This home is located at 333 N 12th St, Coshocton, OH 43812 and is currently estimated at $103,804, approximately $49 per square foot. 333 N 12th St is a home located in Coshocton County with nearby schools including Coshocton High School, Coshocton Opportunity School, and Sacred Heart School.
Ownership History
Date
Name
Owned For
Owner Type
Purchase Details
Closed on
Jan 15, 2018
Sold by
Tuckwell Investments Llc
Bought by
Hall Danny L and Raigner Sarah M
Current Estimated Value
Purchase Details
Closed on
Aug 24, 2009
Sold by
Ker Investments Llc
Bought by
Tuckwell Investment Llc
Purchase Details
Closed on
May 29, 2003
Bought by
Ker Investments Llc
Purchase Details
Closed on
Mar 28, 2003
Sold by
Ferris Richard D
Bought by
Ker Investments Llc
Purchase Details
Closed on
Mar 14, 2002
Bought by
Ferris Richard D
Purchase Details
Closed on
Mar 9, 2001
Sold by
Harrah Christopher B
Bought by
Bank One National Association
Purchase Details
Closed on
Sep 29, 1997
Sold by
Alford Lawrence D
Bought by
Harrah Christopher B
Purchase Details
Closed on
Nov 2, 1995
Sold by
Cramer Craig M
Bought by
Alford Lawrence D
Create a Home Valuation Report for This Property
The Home Valuation Report is an in-depth analysis detailing your home's value as well as a comparison with similar homes in the area
Home Values in the Area
Average Home Value in this Area
Purchase History
| Date | Buyer | Sale Price | Title Company |
|---|---|---|---|
| Hall Danny L | $5,000 | None Available | |
| Tuckwell Investment Llc | -- | None Available | |
| Ker Investments Llc | -- | -- | |
| Ker Investments Llc | -- | -- | |
| Ferris Richard D | $14,500 | -- | |
| Bank One National Association | $40,000 | -- | |
| Bank One National Association | $40,000 | -- | |
| Harrah Christopher B | $42,000 | -- | |
| Alford Lawrence D | $20,000 | -- |
Source: Public Records
Tax History
| Year | Tax Paid | Tax Assessment Tax Assessment Total Assessment is a certain percentage of the fair market value that is determined by local assessors to be the total taxable value of land and additions on the property. | Land | Improvement |
|---|---|---|---|---|
| 2024 | $962 | $23,280 | $3,550 | $19,730 |
| 2023 | $962 | $18,330 | $2,734 | $15,596 |
| 2022 | $919 | $18,330 | $2,730 | $15,600 |
| 2021 | $877 | $18,330 | $2,734 | $15,596 |
| 2020 | $809 | $16,356 | $2,660 | $13,696 |
| 2019 | $818 | $16,356 | $2,660 | $13,696 |
| 2018 | $833 | $16,356 | $2,660 | $13,696 |
| 2017 | $853 | $16,181 | $2,485 | $13,696 |
| 2016 | $820 | $16,181 | $2,485 | $13,696 |
| 2015 | $412 | $16,181 | $2,485 | $13,696 |
| 2014 | $618 | $13,003 | $3,311 | $9,692 |
Source: Public Records
Map
Nearby Homes
Your Personal Tour Guide
Ask me questions while you tour the home.