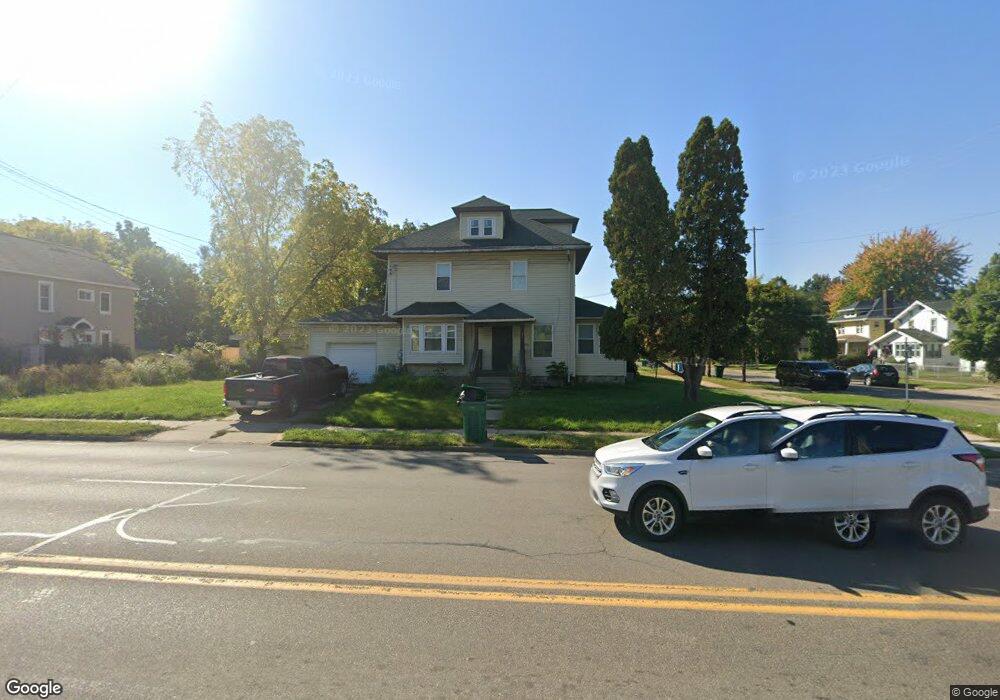
333 N Mlk Blvd Lansing, MI 48915
Westside NeighborhoodEstimated Value: $132,000 - $157,795
--
Bed
--
Bath
1,484
Sq Ft
$93/Sq Ft
Est. Value
About This Home
This home is located at 333 N Mlk Blvd, Lansing, MI 48915 and is currently estimated at $138,699, approximately $93 per square foot. 333 N Mlk Blvd is a home located in Ingham County with nearby schools including Riddle Elementary School, Pattengill Academy, and J.W. Sexton High School.
Ownership History
Date
Name
Owned For
Owner Type
Purchase Details
Closed on
Oct 15, 2019
Sold by
Rhama Word House Llc
Bought by
Hall David
Current Estimated Value
Home Financials for this Owner
Home Financials are based on the most recent Mortgage that was taken out on this home.
Original Mortgage
$50,000
Outstanding Balance
$43,803
Interest Rate
3.5%
Mortgage Type
New Conventional
Estimated Equity
$94,896
Purchase Details
Closed on
Aug 2, 2011
Sold by
Johnson Property Development Ll
Bought by
Rhama Word House Llc
Purchase Details
Closed on
Nov 12, 2004
Sold by
Johnson Earvin and Johnson Christine
Bought by
Johnson Property Development Llc
Home Financials for this Owner
Home Financials are based on the most recent Mortgage that was taken out on this home.
Original Mortgage
$170,000
Interest Rate
5.86%
Mortgage Type
Commercial
Create a Home Valuation Report for This Property
The Home Valuation Report is an in-depth analysis detailing your home's value as well as a comparison with similar homes in the area
Home Values in the Area
Average Home Value in this Area
Purchase History
| Date | Buyer | Sale Price | Title Company |
|---|---|---|---|
| Hall David | $38,000 | Liberty Title | |
| Rhama Word House Llc | $40,000 | Liberty Title | |
| Rhama Word House Llc | -- | None Available | |
| Johnson Property Development Llc | $170,000 | Michigan Bankers Title Of Mi |
Source: Public Records
Mortgage History
| Date | Status | Borrower | Loan Amount |
|---|---|---|---|
| Open | Hall David | $50,000 | |
| Previous Owner | Johnson Property Development Llc | $170,000 |
Source: Public Records
Tax History Compared to Growth
Tax History
| Year | Tax Paid | Tax Assessment Tax Assessment Total Assessment is a certain percentage of the fair market value that is determined by local assessors to be the total taxable value of land and additions on the property. | Land | Improvement |
|---|---|---|---|---|
| 2025 | $5,165 | $70,900 | $6,600 | $64,300 |
| 2024 | $44 | $69,300 | $6,600 | $62,700 |
| 2023 | $4,787 | $59,700 | $6,600 | $53,100 |
| 2022 | $7,824 | $55,700 | $9,100 | $46,600 |
| 2021 | $117 | $0 | $0 | $0 |
| 2020 | $1,860 | $0 | $0 | $0 |
| 2019 | $170 | $0 | $0 | $0 |
| 2018 | $170 | $0 | $0 | $0 |
| 2017 | $75 | $0 | $0 | $0 |
| 2016 | $95 | $0 | $0 | $0 |
| 2015 | $95 | $16,915 | $16,915 | $0 |
| 2014 | $95 | $22,000 | $22,000 | $0 |
Source: Public Records
Map
Nearby Homes
- 416 N Martin Luther King Junior Blvd
- 418 N Martin Luther King Junior Blvd
- 422 N Martin Luther King Junior Blvd
- 1017 W Genesee St
- 312 N Butler Blvd
- 427 N Butler Blvd
- 425/425.5 N Butler Blvd
- 433 N Butler Blvd
- 1128 W Michigan Ave
- 1313 S Genesee Dr
- 1232 W Michigan Ave
- 531 N Butler Blvd
- 1314 W Ottawa St
- 325 N Sycamore St
- 1234 W Allegan St
- 1319 W Michigan Ave
- 1217 W Saginaw St
- 1221 W Saginaw St
- 1225 W Saginaw St
- 1229 W Saginaw St
- 333 N Martin Luther King jr Blvd
- 333 N Martin Luther King Junior Blvd
- 1105 W Shiawassee St
- 325 N Martin Luther King Junior Blvd
- 1109 W Shiawassee St
- 325 N Mlk
- 325 N Mlk Blvd
- 325 N Mlk
- 325 N Martin Luther King jr Blvd
- 1113 W Shiawassee St
- 330 N Martin Luther King jr Blvd
- 330 N Mlk Blvd
- 328 N Martin Luther King Junior Blvd
- 319 N Mlk Blvd
- 328 N Mlk Blvd
- 328 N Martin Luther King jr Blvd
- 1100 W Shiawassee St
- 326 N Mlk Blvd
- 320 N Mlk Blvd
- 1119 W Shiawassee St