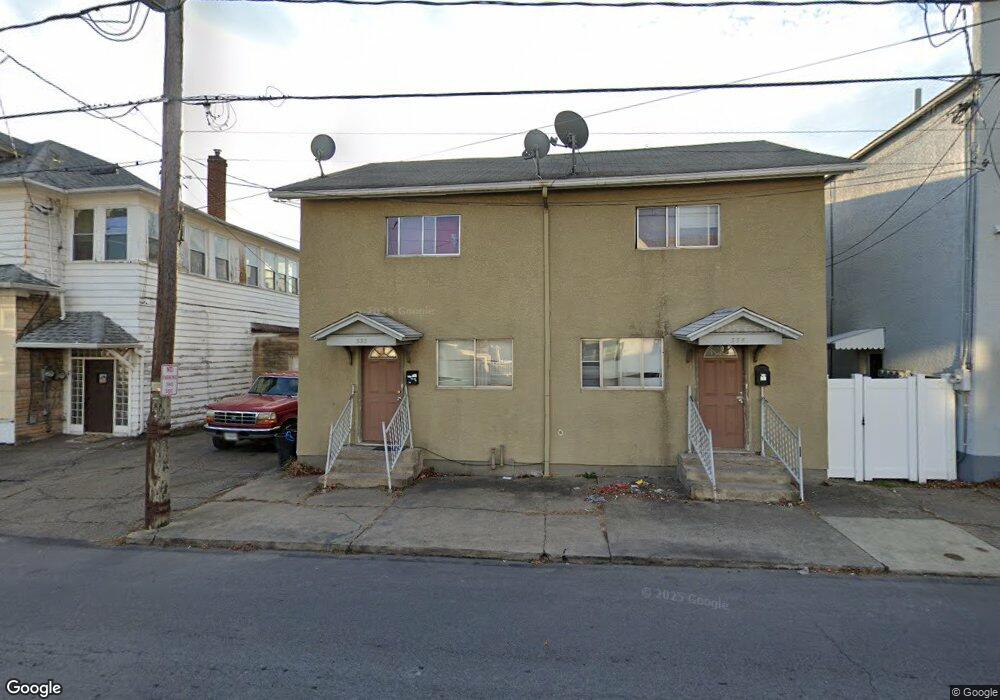
333 Oak St Unit 333 1/2 Scranton, PA 18508
Tripp's Park NeighborhoodEstimated Value: $86,000 - $134,000
--
Bed
--
Bath
--
Sq Ft
2,004
Sq Ft Lot
About This Home
This home is located at 333 Oak St Unit 333 1/2, Scranton, PA 18508 and is currently estimated at $107,983. 333 Oak St Unit 333 1/2 is a home located in Lackawanna County with nearby schools including Neil Armstrong Elementary School, Pinchbeck Elementary School, and Pemberton Elementary School.
Ownership History
Date
Name
Owned For
Owner Type
Purchase Details
Closed on
Oct 27, 2022
Sold by
Yantorn Anthony J
Bought by
Scranton Prosper Llc
Current Estimated Value
Purchase Details
Closed on
Apr 5, 2007
Sold by
Stein Bruce A and Stein Erica
Bought by
Yantorn Anthony J and Yantorn Sabine
Purchase Details
Closed on
Jun 6, 2006
Sold by
Stein Bruce A and Cangiano Joseph M
Bought by
Stein Bruce A and Witte George
Home Financials for this Owner
Home Financials are based on the most recent Mortgage that was taken out on this home.
Original Mortgage
$54,000
Interest Rate
6.4%
Mortgage Type
New Conventional
Purchase Details
Closed on
Apr 27, 2006
Sold by
Marinucci Richard R and Marinucci Lori A
Bought by
Stein Bruce A and Cangiano Joseph M
Home Financials for this Owner
Home Financials are based on the most recent Mortgage that was taken out on this home.
Original Mortgage
$54,000
Interest Rate
6.4%
Mortgage Type
New Conventional
Create a Home Valuation Report for This Property
The Home Valuation Report is an in-depth analysis detailing your home's value as well as a comparison with similar homes in the area
Home Values in the Area
Average Home Value in this Area
Purchase History
| Date | Buyer | Sale Price | Title Company |
|---|---|---|---|
| Scranton Prosper Llc | $60,000 | None Listed On Document | |
| Yantorn Anthony J | $86,000 | None Available | |
| Stein Bruce A | -- | None Available | |
| Stein Bruce A | $60,000 | None Available |
Source: Public Records
Mortgage History
| Date | Status | Borrower | Loan Amount |
|---|---|---|---|
| Previous Owner | Stein Bruce A | $54,000 |
Source: Public Records
Tax History Compared to Growth
Tax History
| Year | Tax Paid | Tax Assessment Tax Assessment Total Assessment is a certain percentage of the fair market value that is determined by local assessors to be the total taxable value of land and additions on the property. | Land | Improvement |
|---|---|---|---|---|
| 2025 | $2,555 | $7,851 | $1,400 | $6,451 |
| 2024 | $2,337 | $7,851 | $1,400 | $6,451 |
| 2023 | $2,337 | $7,851 | $1,400 | $6,451 |
| 2022 | $2,286 | $7,851 | $1,400 | $6,451 |
| 2021 | $2,286 | $7,851 | $1,400 | $6,451 |
| 2020 | $2,244 | $7,851 | $1,400 | $6,451 |
| 2019 | $2,111 | $7,851 | $1,400 | $6,451 |
| 2018 | $2,111 | $7,851 | $1,400 | $6,451 |
| 2017 | $2,074 | $7,851 | $1,400 | $6,451 |
| 2016 | $0 | $7,851 | $1,400 | $6,451 |
| 2015 | $1,562 | $7,851 | $1,400 | $6,451 |
| 2014 | -- | $7,851 | $1,400 | $6,451 |
Source: Public Records
Map
Nearby Homes
- 1729 Wayne Ave
- 314 W Market St
- 1711 N Sumner Ave
- 231 Putnam St
- 337 Spring St
- 401 Putnam St
- 1515-1517 Brick Ave
- 440 Leggett St
- 332 Spring St
- 1810 Cusick Ave
- 117 Ferdinand St
- 2040 Margaret Ave Unit 2042
- 2040 Edna Ave
- 2113 Golden Ave
- 2105 Belmont Terrace
- 119 Spring St
- 1402 N Rebecca Ave
- 2089 N Main Ave
- 2219 Golden Ave
- 1436 Church Ave
- 333 333 1 2 Oak St
- 333 335 Oak St
- 1780 Brick Ave
- 1776 Brick Ave
- 1774 Brick Ave Unit 1
- 1774 Brick Ave Unit 2
- 1770 Brick Ave
- 1804 Brick Ave Unit 1806
- 329 Oak St
- 1766 Brick Ave Unit 1768
- 321 Oak St
- 1803 Brick Ave
- 330 Oak St
- 1810 Brick Ave
- 1767 Brick Ave Unit 1769
- 1767 1769 Brick Ave
- 322 Oak St
- 1809 Brick Ave
- 410 Oak St
- 410 Oak St