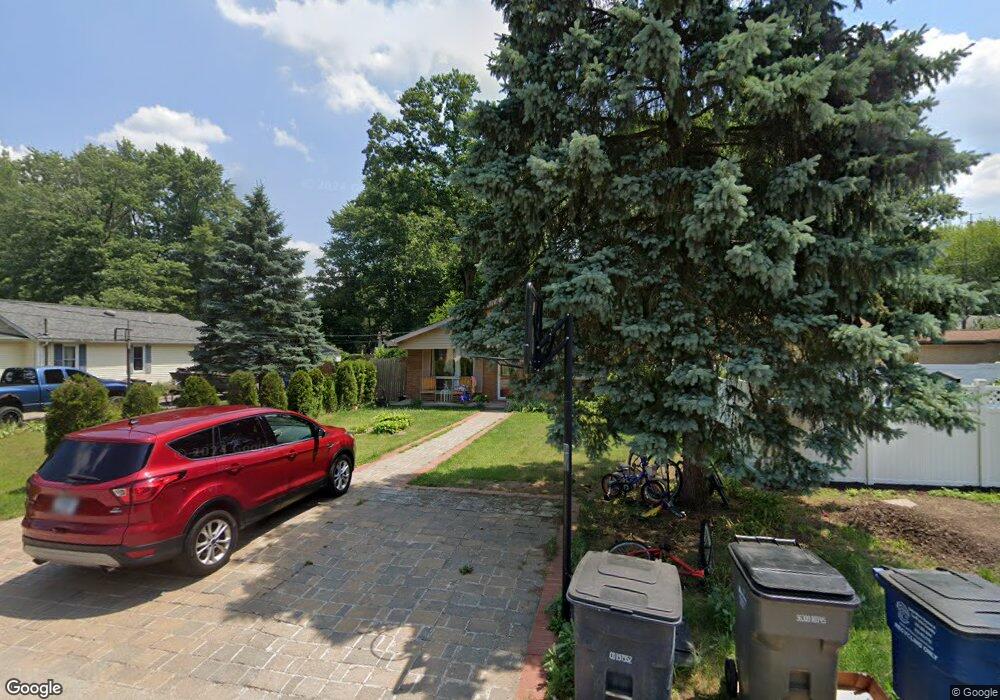
333 Oakland Ave Trail Creek, IN 46360
Estimated Value: $151,000 - $210,000
3
Beds
1
Bath
952
Sq Ft
$179/Sq Ft
Est. Value
About This Home
This home is located at 333 Oakland Ave, Trail Creek, IN 46360 and is currently estimated at $170,667, approximately $179 per square foot. 333 Oakland Ave is a home located in LaPorte County with nearby schools including Joy Elementary School, Martin T. Krueger Middle School, and Michigan City High School.
Ownership History
Date
Name
Owned For
Owner Type
Purchase Details
Closed on
Jun 11, 2010
Sold by
Ramos Eusebio S
Bought by
Ramos Eusebio S and Ramos Ermila L
Current Estimated Value
Home Financials for this Owner
Home Financials are based on the most recent Mortgage that was taken out on this home.
Original Mortgage
$35,381
Interest Rate
4.83%
Mortgage Type
New Conventional
Purchase Details
Closed on
Mar 23, 2010
Sold by
Peeples Betsy
Bought by
Federal National Mortgage Association
Purchase Details
Closed on
May 27, 2005
Sold by
Magnuson Christopher P and Mills Shannon E
Bought by
Peeples Betsy
Home Financials for this Owner
Home Financials are based on the most recent Mortgage that was taken out on this home.
Original Mortgage
$90,000
Interest Rate
5.91%
Mortgage Type
Fannie Mae Freddie Mac
Create a Home Valuation Report for This Property
The Home Valuation Report is an in-depth analysis detailing your home's value as well as a comparison with similar homes in the area
Home Values in the Area
Average Home Value in this Area
Purchase History
| Date | Buyer | Sale Price | Title Company |
|---|---|---|---|
| Ramos Eusebio S | -- | Sojourners Title Agency | |
| Ramos Eusebio S | $44,227 | None Available | |
| Federal National Mortgage Association | $107,752 | None Available | |
| Peeples Betsy | -- | Meridian Title Corp |
Source: Public Records
Mortgage History
| Date | Status | Borrower | Loan Amount |
|---|---|---|---|
| Closed | Ramos Eusebio S | $35,381 | |
| Previous Owner | Peeples Betsy | $90,000 |
Source: Public Records
Tax History Compared to Growth
Tax History
| Year | Tax Paid | Tax Assessment Tax Assessment Total Assessment is a certain percentage of the fair market value that is determined by local assessors to be the total taxable value of land and additions on the property. | Land | Improvement |
|---|---|---|---|---|
| 2024 | $2,126 | $109,500 | $11,300 | $98,200 |
| 2023 | $2,054 | $102,700 | $11,300 | $91,400 |
| 2022 | $1,566 | $95,000 | $11,300 | $83,700 |
| 2021 | $1,566 | $78,300 | $11,300 | $67,000 |
| 2020 | $1,510 | $78,300 | $11,300 | $67,000 |
| 2019 | $1,432 | $69,200 | $9,800 | $59,400 |
| 2018 | $1,398 | $67,500 | $9,800 | $57,700 |
| 2017 | $1,416 | $68,300 | $6,400 | $61,900 |
| 2016 | $1,402 | $67,600 | $6,400 | $61,200 |
| 2014 | $1,310 | $65,400 | $6,300 | $59,100 |
Source: Public Records
Map
Nearby Homes
- 102 Whisper Dunes Dr
- 419 Spruce Dr
- 231 Avondale Ave
- 210 Finch Trail
- 613 Dogwood Dr
- 403 Firefly Dr
- 207 Meadowlark Dr
- 617 Black Oak Dr
- 105 Starling Dr
- 520 Johnson Rd
- 404 Cricket Ln
- 1034 Providence St
- 2321 Greenwood Ave
- 606 Sunnyside Dr
- 0 Salem Ct
- 2905 E Michigan Blvd
- 116 Coolspring Cir
- 2405 Del Plain Ave
- 522 Highland Ave
- 537 Walton Ave