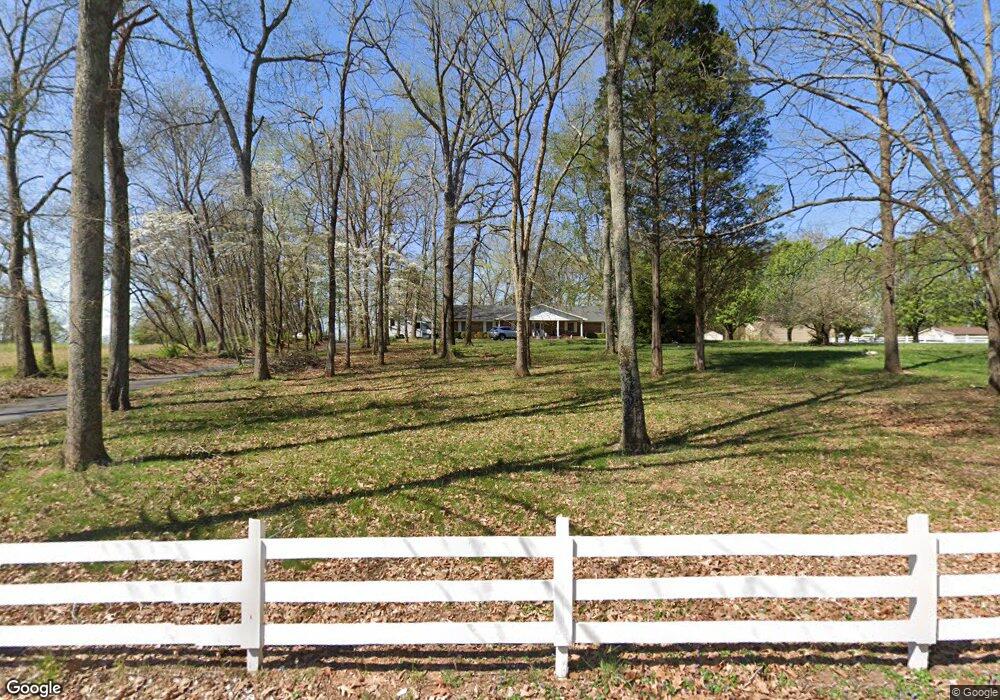
333 Old Tram Rd Bowling Green, KY 42101
Greystone NeighborhoodEstimated Value: $394,000 - $482,410
4
Beds
3
Baths
2,387
Sq Ft
$184/Sq Ft
Est. Value
About This Home
This home is located at 333 Old Tram Rd, Bowling Green, KY 42101 and is currently estimated at $440,103, approximately $184 per square foot. 333 Old Tram Rd is a home located in Warren County with nearby schools including Rockfield Elementary School, Henry F. Moss Middle School, and Warren Central High School.
Ownership History
Date
Name
Owned For
Owner Type
Purchase Details
Closed on
Feb 3, 2023
Sold by
Tucker Anne G
Bought by
Jepson Jesse T and Jepson Connie C
Current Estimated Value
Purchase Details
Closed on
Apr 27, 2022
Sold by
Carlos Taylor
Bought by
Commonwealth Of Kentucky and Transportation Cabinet
Purchase Details
Closed on
Mar 25, 2022
Sold by
Le Young J L
Bought by
Taylor Carlos
Purchase Details
Closed on
Feb 21, 2022
Sold by
Carlos Taylor
Bought by
Commonweaelth Of Kentucky
Purchase Details
Closed on
Jan 17, 2022
Sold by
Mackenzie Meadows Llc
Bought by
Taylor Carlos
Purchase Details
Closed on
Aug 10, 2021
Sold by
Collins Angela and The Estate Of Ursa L Davis
Bought by
Taylor Carlos
Purchase Details
Closed on
Jun 10, 2021
Sold by
Davis Ursa L
Bought by
Taylor Carlos
Purchase Details
Closed on
Jan 1, 2021
Sold by
Caaarlos Taylor
Bought by
Blankenship Jon and Blankenship Judy
Create a Home Valuation Report for This Property
The Home Valuation Report is an in-depth analysis detailing your home's value as well as a comparison with similar homes in the area
Home Values in the Area
Average Home Value in this Area
Purchase History
| Date | Buyer | Sale Price | Title Company |
|---|---|---|---|
| Jepson Jesse T | -- | -- | |
| Jepson Jesse T | -- | None Listed On Document | |
| Commonwealth Of Kentucky | $19,000 | Hurst Luci R | |
| Taylor Carlos | $25,000 | None Listed On Document | |
| Commonweaelth Of Kentucky | $95,000 | Hurst Luci R | |
| Taylor Carlos | $300,000 | Foreman Watson Holtrey Llp | |
| Taylor Carlos | $300,000 | None Listed On Document | |
| Taylor Carlos | $169,595 | None Available | |
| Taylor Carlos | $10,000 | Parker Harlin | |
| Blankenship Jon | $49,900 | Reynolds Johnston Hinton Llp |
Source: Public Records
Tax History Compared to Growth
Tax History
| Year | Tax Paid | Tax Assessment Tax Assessment Total Assessment is a certain percentage of the fair market value that is determined by local assessors to be the total taxable value of land and additions on the property. | Land | Improvement |
|---|---|---|---|---|
| 2024 | $3,781 | $438,700 | $0 | $0 |
| 2023 | $1,368 | $200,000 | $0 | $0 |
| 2022 | $1,327 | $200,000 | $0 | $0 |
| 2021 | $1,322 | $200,000 | $0 | $0 |
| 2020 | $1,216 | $185,000 | $0 | $0 |
| 2019 | $1,213 | $185,000 | $0 | $0 |
| 2018 | $1,221 | $185,000 | $0 | $0 |
| 2017 | $1,213 | $148,100 | $0 | $0 |
| 2015 | $1,118 | $138,100 | $0 | $0 |
| 2014 | $1,108 | $139,000 | $0 | $0 |
Source: Public Records
Map
Nearby Homes
- 484 Superior Ct
- 561 Standard Ave
- 587 Noble Ct
- 567 Standard Ave
- 593 Noble Ct
- 579 Standard Ave
- 4634 Pinetree Ln
- 568 Merit Ct
- 219 Ford Ave
- The Collins Plan at The Standard at Blue Level
- The Rockaway Plan at The Standard at Blue Level
- The Victoria Plan at The Standard at Blue Level
- The Atkins Plan at The Standard at Blue Level
- The Stanford 2 Plan at The Standard at Blue Level
- 614 Merit St
- 237 Ford Ave
- 308 Memphis Junction Rd
- 609 Standard Ave
- 623 Merit St
- 615 Standard Ave
- 337 Old Tram Rd
- 415 Old Tram Rd
- 475 Old Tram Rd
- 501 Old Tram Rd
- 525 Old Tram Rd
- 549 Old Tram Rd
- 300 Blue Level Rd
- 516 Standard Ave
- 510 Standard Ave
- 540 Standard Ave Unit Lot 71
- 528 Standard Ave
- 506 Old Tram Rd
- 465 Standard Ave
- 375 Standard Ave
- 360 Blue Level Rd
- 4557 Wal Valley Way
- 530 Old Tram Rd
- 4551 Wal Valley Way
- 4545 Wal Valley Way
- 4563 Wal Valley Way