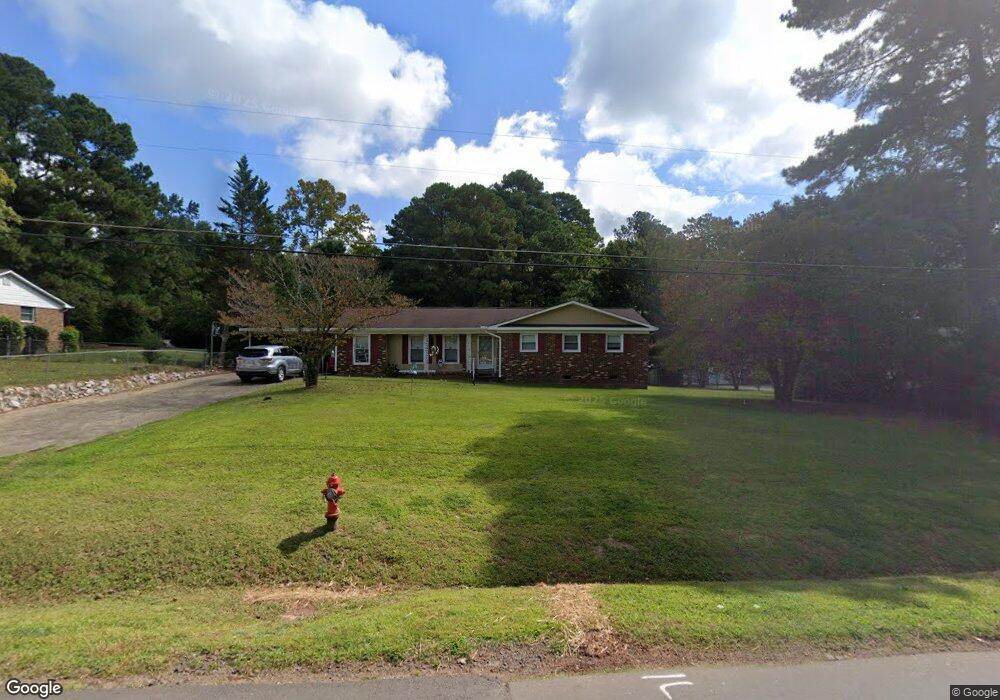
333 Olive Branch Rd Durham, NC 27703
Eastern Durham NeighborhoodEstimated Value: $308,826 - $424,000
3
Beds
2
Baths
1,605
Sq Ft
$230/Sq Ft
Est. Value
About This Home
This home is located at 333 Olive Branch Rd, Durham, NC 27703 and is currently estimated at $369,207, approximately $230 per square foot. 333 Olive Branch Rd is a home located in Durham County with nearby schools including Spring Valley Elementary School, John W Neal Middle School, and Southern School of Energy & Sustainability.
Ownership History
Date
Name
Owned For
Owner Type
Purchase Details
Closed on
May 30, 2000
Sold by
Spruill Jr Lorenza D and Spruill Marjorie C
Bought by
Delargy John Patrick and Delargy Tonya E
Current Estimated Value
Home Financials for this Owner
Home Financials are based on the most recent Mortgage that was taken out on this home.
Original Mortgage
$106,050
Outstanding Balance
$37,173
Interest Rate
8.14%
Mortgage Type
Seller Take Back
Estimated Equity
$332,034
Create a Home Valuation Report for This Property
The Home Valuation Report is an in-depth analysis detailing your home's value as well as a comparison with similar homes in the area
Home Values in the Area
Average Home Value in this Area
Purchase History
| Date | Buyer | Sale Price | Title Company |
|---|---|---|---|
| Delargy John Patrick | $110,000 | -- |
Source: Public Records
Mortgage History
| Date | Status | Borrower | Loan Amount |
|---|---|---|---|
| Open | Delargy John Patrick | $106,050 |
Source: Public Records
Tax History
| Year | Tax Paid | Tax Assessment Tax Assessment Total Assessment is a certain percentage of the fair market value that is determined by local assessors to be the total taxable value of land and additions on the property. | Land | Improvement |
|---|---|---|---|---|
| 2025 | $2,177 | $298,178 | $94,375 | $203,803 |
| 2024 | $1,887 | $176,332 | $37,625 | $138,707 |
| 2023 | $1,816 | $176,332 | $37,625 | $138,707 |
| 2022 | $1,760 | $176,332 | $37,625 | $138,707 |
| 2021 | $1,547 | $176,332 | $37,625 | $138,707 |
| 2020 | $1,511 | $176,332 | $37,625 | $138,707 |
| 2019 | $1,494 | $176,332 | $37,625 | $138,707 |
| 2018 | $1,445 | $156,604 | $45,150 | $111,454 |
| 2017 | $1,398 | $156,604 | $45,150 | $111,454 |
| 2016 | $1,355 | $156,604 | $45,150 | $111,454 |
| 2015 | $1,700 | $169,121 | $32,446 | $136,675 |
| 2014 | $1,709 | $169,121 | $32,446 | $136,675 |
Source: Public Records
Map
Nearby Homes
- 637 Conover Rd Unit B
- 639 Conover Rd Unit A
- 639 Conover Rd Unit B
- 635 Conover Rd Unit A
- 635 Conover Rd Unit B
- 2020 Rockface Way
- 2012 Sandwood Loch Dr
- 1116 Lily Loch Way
- 503 Hester Rd
- 505 Hester Rd
- 507 Hester Rd
- 511 Hester Rd
- 1417 Underbrush Dr
- 631 Ashburn Ln
- 800 Olive Branch Rd
- 1125 Arbor Edge Ln
- 3024 Bay Foal Ln
- 5923 Woodlawn Dr
- 3020 Bay Foal Ln
- 3018 Bay Foal Ln
- 339 Olive Branch Rd
- 327 Olive Branch Rd
- 404 Asbury Ct
- 345 Olive Branch Rd
- 378 Asbury Ct
- 330 Olive Branch Rd
- 321 Olive Branch Rd
- 401 Olive Branch Rd
- 324 Olive Branch Rd
- 344 Olive Branch Rd
- 320 Olive Branch Rd
- 320 Asbury Ct
- 341 Bandock Dr
- 345 Bandock Dr
- 333 Bandock Dr
- 316 Olive Branch Rd
- 353 Bandock Dr
- 323 Asbury Ct
- 327 Bandock Dr
- 307 Asbury Ct
Your Personal Tour Guide
Ask me questions while you tour the home.