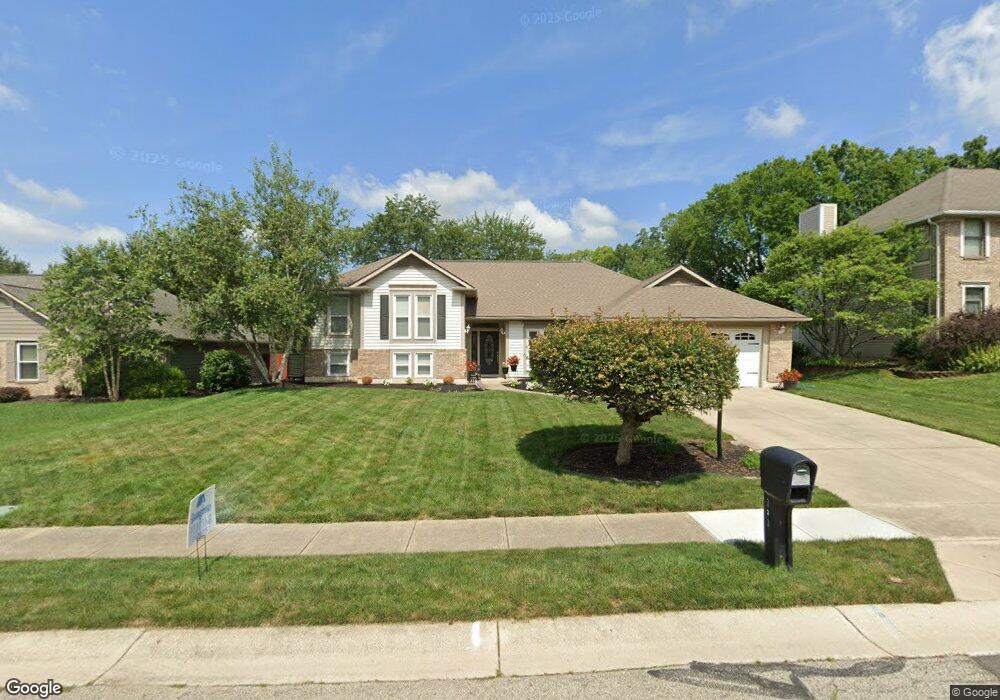
333 Park Ln Springboro, OH 45066
Estimated Value: $366,000 - $406,000
3
Beds
3
Baths
1,978
Sq Ft
$196/Sq Ft
Est. Value
About This Home
This home is located at 333 Park Ln, Springboro, OH 45066 and is currently estimated at $388,063, approximately $196 per square foot. 333 Park Ln is a home located in Warren County with nearby schools including Clearcreek Elementary School, Springboro Intermediate School, and Dennis Elementary School.
Ownership History
Date
Name
Owned For
Owner Type
Purchase Details
Closed on
Oct 21, 2019
Sold by
Williams Daniel E
Bought by
Williams Daniel E and Williams Christopher E
Current Estimated Value
Home Financials for this Owner
Home Financials are based on the most recent Mortgage that was taken out on this home.
Original Mortgage
$131,600
Outstanding Balance
$115,288
Interest Rate
3.5%
Mortgage Type
New Conventional
Estimated Equity
$272,775
Purchase Details
Closed on
Oct 1, 2019
Sold by
Williams Debbie J
Bought by
Williams Daniel E
Home Financials for this Owner
Home Financials are based on the most recent Mortgage that was taken out on this home.
Original Mortgage
$131,600
Outstanding Balance
$115,288
Interest Rate
3.5%
Mortgage Type
New Conventional
Estimated Equity
$272,775
Purchase Details
Closed on
Aug 2, 1993
Sold by
Oberer Development Co
Bought by
Williams and Williams Daniel E
Purchase Details
Closed on
Jul 19, 1988
Sold by
Oberer Development Co
Bought by
Oberer Development Co.
Create a Home Valuation Report for This Property
The Home Valuation Report is an in-depth analysis detailing your home's value as well as a comparison with similar homes in the area
Home Values in the Area
Average Home Value in this Area
Purchase History
| Date | Buyer | Sale Price | Title Company |
|---|---|---|---|
| Williams Daniel E | -- | Hallmark Title | |
| Williams Daniel E | -- | Hallmark Title | |
| Williams | $168,600 | -- | |
| Oberer Development Co. | -- | -- |
Source: Public Records
Mortgage History
| Date | Status | Borrower | Loan Amount |
|---|---|---|---|
| Open | Williams Daniel E | $131,600 |
Source: Public Records
Tax History Compared to Growth
Tax History
| Year | Tax Paid | Tax Assessment Tax Assessment Total Assessment is a certain percentage of the fair market value that is determined by local assessors to be the total taxable value of land and additions on the property. | Land | Improvement |
|---|---|---|---|---|
| 2024 | $3,947 | $110,880 | $26,250 | $84,630 |
| 2023 | $3,557 | $92,274 | $17,220 | $75,054 |
| 2022 | $3,504 | $92,274 | $17,220 | $75,054 |
| 2021 | $3,261 | $92,274 | $17,220 | $75,054 |
| 2020 | $3,351 | $75,019 | $14,000 | $61,019 |
| 2019 | $2,729 | $75,019 | $14,000 | $61,019 |
| 2018 | $2,731 | $75,019 | $14,000 | $61,019 |
| 2017 | $2,503 | $63,448 | $12,033 | $51,415 |
| 2016 | $2,610 | $63,448 | $12,033 | $51,415 |
| 2015 | $2,638 | $63,448 | $12,033 | $51,415 |
| 2014 | $2,638 | $61,010 | $11,570 | $49,440 |
| 2013 | $2,636 | $73,820 | $14,000 | $59,820 |
Source: Public Records
Map
Nearby Homes
- 120 Clearview Dr
- 145 Cedar Hill Ln
- 375 Tamarack Trail
- 150 Tanglewood Dr
- 450 Evergreen Dr
- 15 Belvoir Ct
- 20 Terradyne Trace
- 125 W Market St
- 145 Woods Rd
- 510 Royal Springs Dr
- The McPherson Plan at Wadestone - Designer Collection
- Winslow Plan at Wadestone - Masterpiece Collection
- Avery Plan at Wadestone - Designer Collection
- Emmett Plan at Wadestone - Designer Collection
- Rhodes Plan at Wadestone - Masterpiece Collection
- Carrington Plan at Wadestone - Designer Collection
- Winston Plan at Wadestone - Designer Collection
- Paxton Plan at Wadestone - Masterpiece Collection
- Calvin Plan at Wadestone - Designer Collection
- Magnolia Plan at Wadestone - Designer Collection