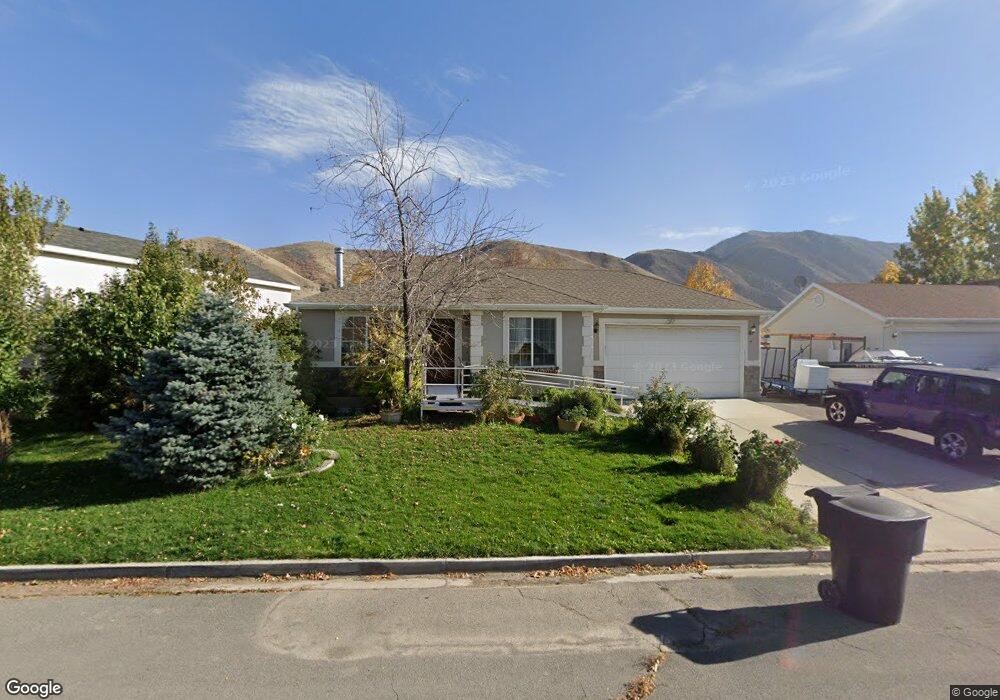
333 Pommell Dr Payson, UT 84651
Estimated Value: $427,000 - $459,706
4
Beds
2
Baths
2,049
Sq Ft
$219/Sq Ft
Est. Value
About This Home
This home is located at 333 Pommell Dr, Payson, UT 84651 and is currently estimated at $448,427, approximately $218 per square foot. 333 Pommell Dr is a home located in Utah County with nearby schools including Spring Lake Elementary, Payson High School, and Payson Junior High School.
Ownership History
Date
Name
Owned For
Owner Type
Purchase Details
Closed on
Jan 18, 2012
Sold by
Taylor Henry Thomas and Taylor Stephanie
Bought by
Taylor Henry Thomas and Taylor Stephanie
Current Estimated Value
Home Financials for this Owner
Home Financials are based on the most recent Mortgage that was taken out on this home.
Original Mortgage
$240,000
Outstanding Balance
$164,143
Interest Rate
3.93%
Mortgage Type
Reverse Mortgage Home Equity Conversion Mortgage
Estimated Equity
$284,284
Purchase Details
Closed on
Mar 11, 2008
Sold by
Collins Rose Jessie
Bought by
Taylor Henry Thomas and Taylor Stephanie
Purchase Details
Closed on
Mar 19, 2003
Sold by
Collins Rose Jessie and Taylor Henry Thomas
Bought by
Taylor Henry Thomas and Taylor Stephanie
Purchase Details
Closed on
Nov 17, 2000
Sold by
Salisbury Development Lc
Bought by
Nebeker Thane
Home Financials for this Owner
Home Financials are based on the most recent Mortgage that was taken out on this home.
Original Mortgage
$112,550
Interest Rate
7.82%
Create a Home Valuation Report for This Property
The Home Valuation Report is an in-depth analysis detailing your home's value as well as a comparison with similar homes in the area
Home Values in the Area
Average Home Value in this Area
Purchase History
| Date | Buyer | Sale Price | Title Company |
|---|---|---|---|
| Taylor Henry Thomas | -- | Accommodation | |
| Taylor Henry Thomas | -- | None Available | |
| Taylor Henry Thomas | -- | -- | |
| Nebeker Thane | -- | Provo Land Title Company |
Source: Public Records
Mortgage History
| Date | Status | Borrower | Loan Amount |
|---|---|---|---|
| Open | Taylor Henry Thomas | $240,000 | |
| Previous Owner | Nebeker Thane | $112,550 |
Source: Public Records
Tax History
| Year | Tax Paid | Tax Assessment Tax Assessment Total Assessment is a certain percentage of the fair market value that is determined by local assessors to be the total taxable value of land and additions on the property. | Land | Improvement |
|---|---|---|---|---|
| 2025 | $2,312 | $250,250 | -- | -- |
| 2024 | $2,339 | $235,290 | $0 | $0 |
| 2023 | $2,205 | $238,700 | $0 | $0 |
| 2022 | $2,205 | $221,320 | $0 | $0 |
| 2021 | $1,866 | $300,400 | $99,100 | $201,300 |
| 2020 | $1,582 | $278,600 | $90,100 | $188,500 |
| 2019 | $1,582 | $255,400 | $74,600 | $180,800 |
| 2018 | $1,528 | $237,800 | $65,200 | $172,600 |
| 2017 | $186 | $118,030 | $0 | $0 |
| 2016 | $144 | $111,100 | $0 | $0 |
| 2015 | $381 | $102,465 | $0 | $0 |
| 2014 | $1,091 | $94,875 | $0 | $0 |
Source: Public Records
Map
Nearby Homes
- 32 E 1690 S Unit 113
- 1463 S 260 W
- 609 W Saddlebrook Dr
- 613 W Saddlebrook Dr
- 588 W 1450 S
- 1872 100 E Unit 6
- 347 W 1380 S
- 211 W 1800 S
- 1835 S 410 W
- 1631 S Highway 198
- 1632 S 240 W Unit 47
- 1652 S 240 W Unit 48
- 1848 S 410 W
- 1848 S 100 E Unit 3
- 802 Brookside Ct
- 1579 S 910 W
- 528 W 1150 S
- 336 E 1330 S
- 1468 S 910 W
- 1331 500 E Unit 120
Your Personal Tour Guide
Ask me questions while you tour the home.