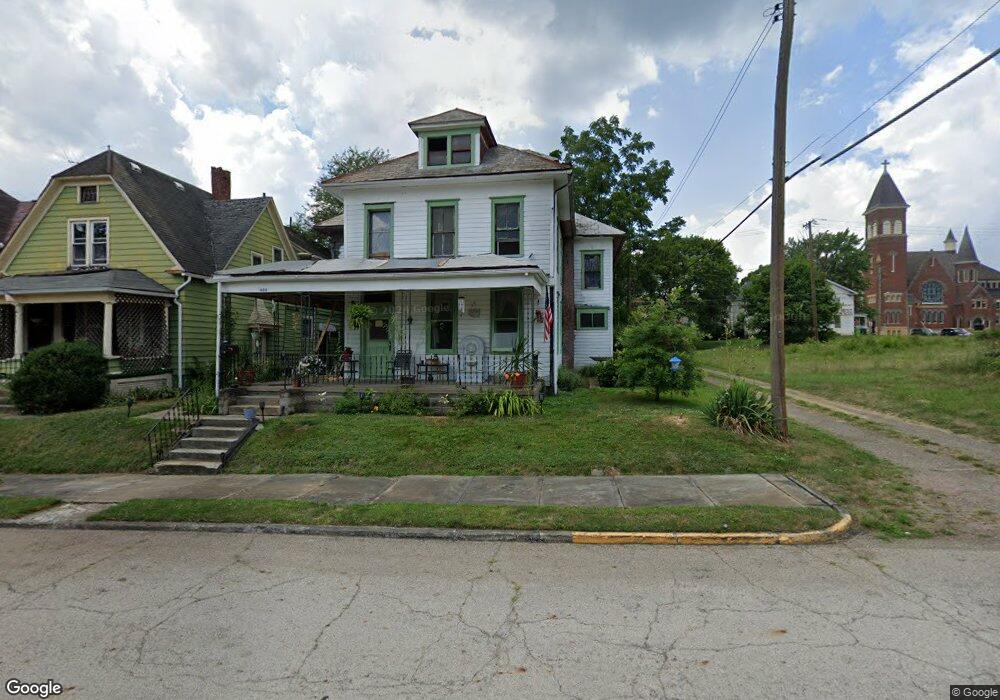
333 S Seneca Ave Alliance, OH 44601
Estimated Value: $51,000 - $102,000
4
Beds
1
Bath
2,394
Sq Ft
$34/Sq Ft
Est. Value
About This Home
This home is located at 333 S Seneca Ave, Alliance, OH 44601 and is currently estimated at $81,289, approximately $33 per square foot. 333 S Seneca Ave is a home located in Stark County with nearby schools including Alliance Intermediate School at Northside, Alliance Elementary School at Rockhill, and Alliance Middle School.
Ownership History
Date
Name
Owned For
Owner Type
Purchase Details
Closed on
Mar 10, 2008
Sold by
Ghattas Reemon
Bought by
Walker Jeffrey D and Walker Harry R
Current Estimated Value
Purchase Details
Closed on
Aug 10, 2007
Sold by
Franklin Credit Management Corp
Bought by
Ghattas Reemon
Purchase Details
Closed on
Jan 23, 2007
Sold by
Hudgins G Michael and Hudgins Marla J
Bought by
Franklin Credit Management Corp
Purchase Details
Closed on
Sep 29, 2000
Sold by
Morris Valerie L
Bought by
Hudgins G Michael
Home Financials for this Owner
Home Financials are based on the most recent Mortgage that was taken out on this home.
Original Mortgage
$55,250
Interest Rate
11.25%
Mortgage Type
Adjustable Rate Mortgage/ARM
Purchase Details
Closed on
Sep 28, 2000
Sold by
Morris Andrew D
Bought by
Hudgins G Michael
Home Financials for this Owner
Home Financials are based on the most recent Mortgage that was taken out on this home.
Original Mortgage
$55,250
Interest Rate
11.25%
Mortgage Type
Adjustable Rate Mortgage/ARM
Purchase Details
Closed on
Mar 8, 2000
Sold by
Mcbeth Cecil
Bought by
Morris Andrew D
Purchase Details
Closed on
Apr 12, 1993
Create a Home Valuation Report for This Property
The Home Valuation Report is an in-depth analysis detailing your home's value as well as a comparison with similar homes in the area
Home Values in the Area
Average Home Value in this Area
Purchase History
| Date | Buyer | Sale Price | Title Company |
|---|---|---|---|
| Walker Jeffrey D | $7,200 | Attorney | |
| Ghattas Reemon | $4,800 | None Available | |
| Franklin Credit Management Corp | $16,000 | None Available | |
| Hudgins G Michael | $22,000 | -- | |
| Hudgins G Michael | $22,000 | -- | |
| Morris Andrew D | $25,000 | -- | |
| -- | -- | -- |
Source: Public Records
Mortgage History
| Date | Status | Borrower | Loan Amount |
|---|---|---|---|
| Previous Owner | Hudgins G Michael | $55,250 |
Source: Public Records
Tax History Compared to Growth
Tax History
| Year | Tax Paid | Tax Assessment Tax Assessment Total Assessment is a certain percentage of the fair market value that is determined by local assessors to be the total taxable value of land and additions on the property. | Land | Improvement |
|---|---|---|---|---|
| 2025 | $2,100 | $9,140 | $4,030 | $5,110 |
| 2024 | $2,682 | $9,140 | $4,030 | $5,110 |
| 2023 | $3,130 | $6,450 | $2,070 | $4,380 |
| 2022 | $267 | $6,450 | $2,070 | $4,380 |
| 2021 | $268 | $6,450 | $2,070 | $4,380 |
| 2020 | $262 | $5,890 | $1,790 | $4,100 |
| 2019 | $258 | $5,890 | $1,790 | $4,100 |
| 2018 | $260 | $5,890 | $1,790 | $4,100 |
| 2017 | $1,823 | $5,260 | $1,510 | $3,750 |
| 2016 | $1,497 | $5,260 | $1,510 | $3,750 |
| 2015 | $472 | $5,260 | $1,510 | $3,750 |
| 2014 | $949 | $5,190 | $1,440 | $3,750 |
| 2013 | $124 | $5,190 | $1,440 | $3,750 |
Source: Public Records
Map
Nearby Homes
- V/L S Fredeom Ave
- 356 E Broadway St
- 432 S Linden Ave
- 142 S Seneca Ave
- 361 E Main St
- 452 E Summit St
- 427 S Union Ave
- 263 Franklin Ave
- 831 Wade Ave
- 1005 S Freedom Ave
- 1214 Jersey St
- 814 Milner St
- 807 S Union Ave
- 1044 S Liberty Ave
- 140 W Summit St
- 710 N Freedom Ave
- 163 W Market St
- 132 S Haines Ave
- 1175 S Freedom Ave
- 652 N Webb Ave
- 341 S Seneca Ave
- 548 E High St
- 345 S Seneca Ave
- 542 E High St
- 545 E Broadway St
- 524 E High St
- 527 E Broadway St
- 328 S Freedom Ave
- 330 S Freedom Ave
- 332 S Seneca Ave
- 403 S Seneca Ave
- 543 E High St
- 517 E Broadway St
- 304 S Seneca Ave
- 332 S Freedom Ave
- 535 E High St
- 415 S Seneca Ave
- 324 S Freedom Ave
- 404 S Seneca Ave
- 505 E Broadway St