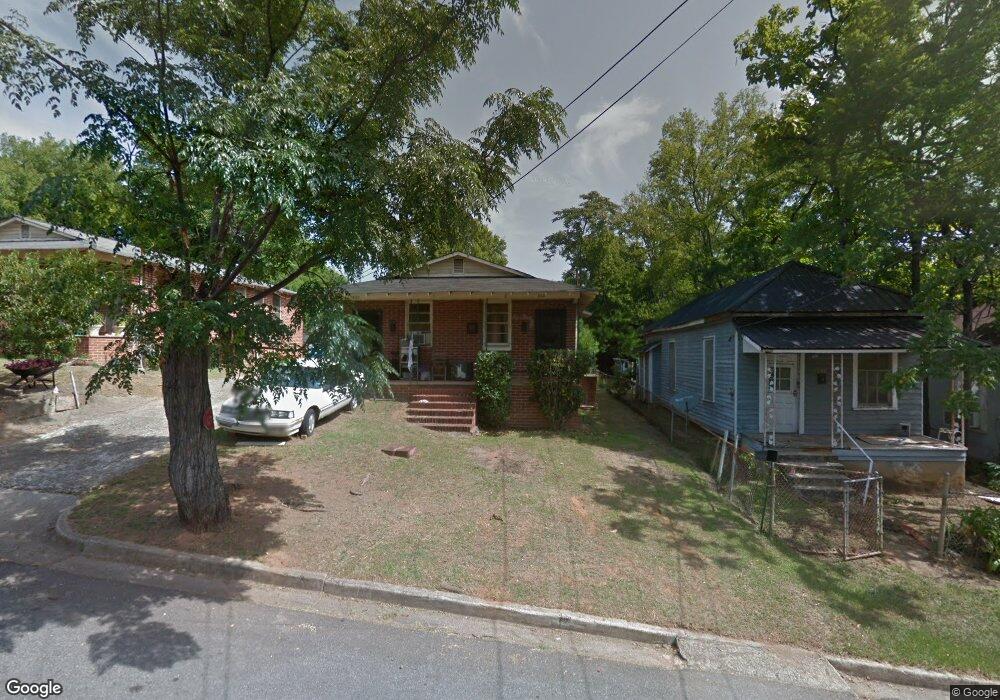
333 Spikes St Macon, GA 31206
Estimated Value: $41,588 - $85,000
3
Beds
2
Baths
1,600
Sq Ft
$40/Sq Ft
Est. Value
About This Home
This home is located at 333 Spikes St, Macon, GA 31206 and is currently estimated at $63,397, approximately $39 per square foot. 333 Spikes St is a home located in Bibb County with nearby schools including Ingram-Pye Elementary School, Central High School, and Cirrus Charter Academy.
Ownership History
Date
Name
Owned For
Owner Type
Purchase Details
Closed on
Mar 14, 2022
Sold by
Haseyya Investments Ltd
Bought by
Yot Homes Llc
Current Estimated Value
Purchase Details
Closed on
Dec 15, 2020
Sold by
Rainier Capital Investments Llc
Bought by
Haseyya Investments Ltd
Purchase Details
Closed on
Feb 19, 2020
Sold by
Gnc Property Inc
Bought by
Lewis Enos
Purchase Details
Closed on
Aug 9, 2017
Sold by
Blumm Georgann D
Bought by
Gnc Properties Inc
Purchase Details
Closed on
Aug 15, 1959
Sold by
Mrs Frances S Dessau
Bought by
Blum Arnold S Spec
Create a Home Valuation Report for This Property
The Home Valuation Report is an in-depth analysis detailing your home's value as well as a comparison with similar homes in the area
Purchase History
| Date | Buyer | Sale Price | Title Company |
|---|---|---|---|
| Yot Homes Llc | $65,000 | None Listed On Document | |
| Haseyya Investments Ltd | $32,000 | None Available | |
| Lewis Enos | $31,500 | None Available | |
| Gnc Properties Inc | -- | None Available | |
| Blum Arnold S Spec | -- | -- |
Source: Public Records
Tax History
| Year | Tax Paid | Tax Assessment Tax Assessment Total Assessment is a certain percentage of the fair market value that is determined by local assessors to be the total taxable value of land and additions on the property. | Land | Improvement |
|---|---|---|---|---|
| 2025 | $167 | $6,776 | $1,680 | $5,096 |
| 2024 | $172 | $6,776 | $1,680 | $5,096 |
| 2023 | $141 | $5,540 | $1,120 | $4,420 |
| 2022 | $126 | $3,644 | $1,867 | $1,777 |
| 2021 | $254 | $6,692 | $1,120 | $5,572 |
| 2020 | $254 | $6,343 | $1,120 | $5,223 |
| 2019 | $243 | $6,082 | $1,120 | $4,962 |
| 2018 | $360 | $6,082 | $1,120 | $4,962 |
| 2017 | $228 | $6,082 | $1,120 | $4,962 |
| 2016 | $210 | $6,082 | $1,120 | $4,962 |
| 2015 | $307 | $6,266 | $1,867 | $4,399 |
| 2014 | $353 | $6,266 | $1,867 | $4,399 |
Source: Public Records
Map
Nearby Homes
- 358 Pittman St
- 2752 Antioch Rd
- 548 Colquitt St
- 2872 Antioch Rd
- 532 Nelson St
- 579 Charles St
- 534 Hanson St
- 2758 Houston Ave
- 678 Dixie Ave
- 579 Rutherford Ave
- 2426 2nd St
- 622 Cleveland St
- 648 Hightower Rd
- 2920 Houston Ave
- 645 Ell St
- 3402 Antioch Rd
- 672 Bowden St
- 534 Robert Henry St
- 2221 Knott Street Ln
- 780 Ponce de Leon Ave
- 335 Spikes St
- 323 Spikes St
- 343 Spikes St
- 341 Spikes St
- 317 Spikes St
- 322 Pittman St Unit B
- 334 Pittman St
- 334 Pittman St Unit A
- 306 Pittman St
- 346 Pittman St
- 334 Spikes St
- 322 Spikes St
- 295 Spikes St
- 2716 Stevens St
- 353 Spikes St
- 361 Spikes St
- 2nd Spikes St
- 296 Pittman St
- 294 Spikes St
- 379 Spikes St
Your Personal Tour Guide
Ask me questions while you tour the home.