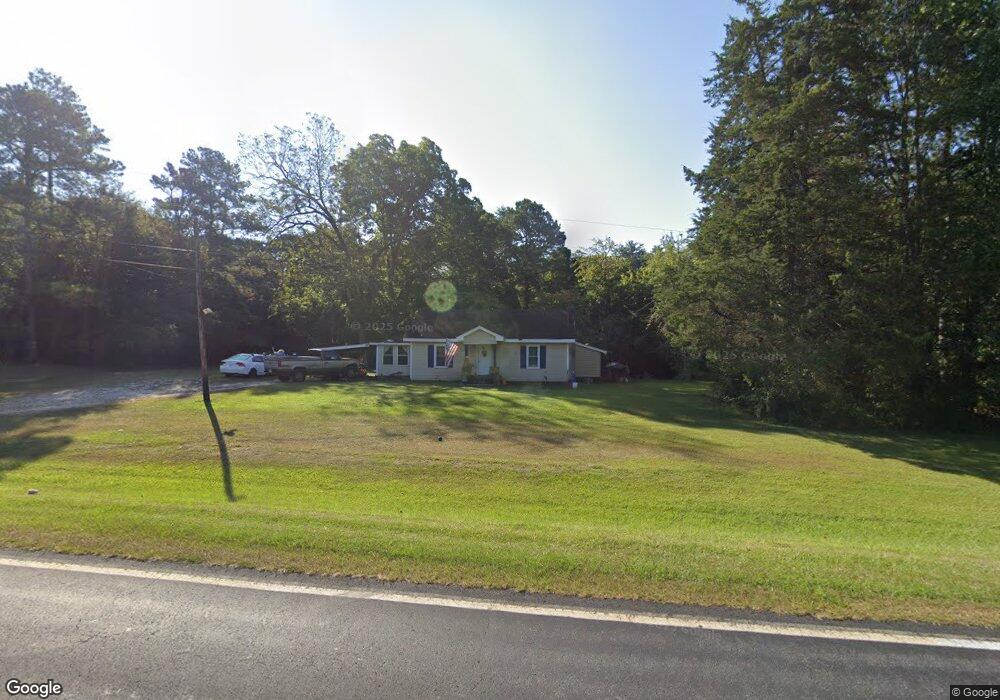
333 Thaxton Rd Franklin, GA 30217
Estimated Value: $113,000 - $207,000
3
Beds
1
Bath
1,360
Sq Ft
$112/Sq Ft
Est. Value
About This Home
This home is located at 333 Thaxton Rd, Franklin, GA 30217 and is currently estimated at $152,986, approximately $112 per square foot. 333 Thaxton Rd is a home located in Heard County with nearby schools including Heard County High School.
Ownership History
Date
Name
Owned For
Owner Type
Purchase Details
Closed on
Oct 18, 2022
Sold by
Smith Brenda H
Bought by
Wiggins Marvin Darold and Wiggins Marlon Dwayne
Current Estimated Value
Purchase Details
Closed on
Mar 17, 2015
Sold by
Smith Vernon Lane
Bought by
Smith Brenda H
Purchase Details
Closed on
Jan 28, 2011
Sold by
Federal National Mortgage Association
Bought by
Smith Vernon L
Purchase Details
Closed on
Jan 24, 2011
Sold by
Chase Home Finance Llc
Bought by
Federal National Mortgage Association
Purchase Details
Closed on
May 4, 2010
Sold by
Thomas Ashley M
Bought by
Chase Home Finance Llc
Purchase Details
Closed on
Jul 18, 2006
Sold by
Not Provided
Bought by
Smith Vernon L
Purchase Details
Closed on
Jul 6, 2006
Sold by
Miller Ray
Bought by
Thomas Ashley M
Purchase Details
Closed on
Apr 5, 1995
Bought by
Miller Ray and Miller Sarah
Create a Home Valuation Report for This Property
The Home Valuation Report is an in-depth analysis detailing your home's value as well as a comparison with similar homes in the area
Purchase History
| Date | Buyer | Sale Price | Title Company |
|---|---|---|---|
| Wiggins Marvin Darold | -- | -- | |
| Smith Brenda H | -- | -- | |
| Smith Brenda H | -- | -- | |
| Smith Vernon L | $31,178 | -- | |
| Federal National Mortgage Association | -- | -- | |
| Chase Home Finance Llc | $73,900 | -- | |
| Smith Vernon L | -- | -- | |
| Thomas Ashley M | $50,000 | -- | |
| Miller Ray | $40,900 | -- |
Source: Public Records
Tax History
| Year | Tax Paid | Tax Assessment Tax Assessment Total Assessment is a certain percentage of the fair market value that is determined by local assessors to be the total taxable value of land and additions on the property. | Land | Improvement |
|---|---|---|---|---|
| 2024 | $849 | $42,122 | $14,016 | $28,106 |
| 2023 | $687 | $32,912 | $11,680 | $21,232 |
| 2022 | $557 | $26,694 | $6,817 | $19,877 |
| 2021 | $490 | $22,282 | $6,817 | $15,465 |
| 2020 | $496 | $22,331 | $6,817 | $15,514 |
| 2019 | $496 | $22,331 | $6,817 | $15,514 |
| 2018 | $416 | $18,385 | $6,817 | $11,568 |
| 2017 | $397 | $17,571 | $6,493 | $11,078 |
| 2016 | $397 | $17,571 | $6,493 | $11,078 |
| 2015 | -- | $19,540 | $10,000 | $9,540 |
| 2014 | -- | $19,545 | $10,000 | $9,545 |
| 2013 | -- | $23,698 | $10,000 | $13,698 |
Source: Public Records
Map
Nearby Homes
- 758 Mahaley Rd
- 19145 Georgia 100
- 2451 Macedonia Rd
- 3354 Antioch Rd
- 2643 Macedonia Rd
- 7971 Roosterville Rd
- 0 Caney Head Rd Unit 10666252
- 0 Caney Head Rd Unit 25965366
- TBD Caney Head Rd
- 319 + - Acres Hwy 100
- 543 Hall Rd
- 140+/- Acres Hwy 100
- 65 Unity Rd
- 85 Unity Rd
- 0 Roosterville Rd Unit 7567146
- 0 Roosterville Rd Unit TRACT 2 10497280
- 0 Roosterville Rd Unit TRACT 4 10561685
- 0 Roosterville Rd Unit TRACT 3 10497284
- 0 Roosterville Rd Unit TRACT 5 10497287
- 0 Roosterville Rd Unit TRACT 4 10497286
- 270 Thaxton Rd
- 690 Thaxton Rd
- 95 Thaxton Rd
- 128 Thaxton Rd
- 35 Thaxton Rd
- 162 Thaxton Rd
- 19959 Ga Highway 100
- 0 Thaxton Road Old Tennessee Hwy Unit 20087664
- 19770 Ga Highway 100
- 660 Thaxton Rd
- 654 Thaxton Rd
- 925 Thaxton Rd
- 19910 Ga Highway 100
- 800 Thaxton Rd
- 20201 Ga Highway 100
- 961 Thaxton Rd
- 19625 Ga Highway 100
- 20285 Ga Highway 100
- 19716 Ga Highway 100
- 19644 Ga Highway 100
Your Personal Tour Guide
Ask me questions while you tour the home.