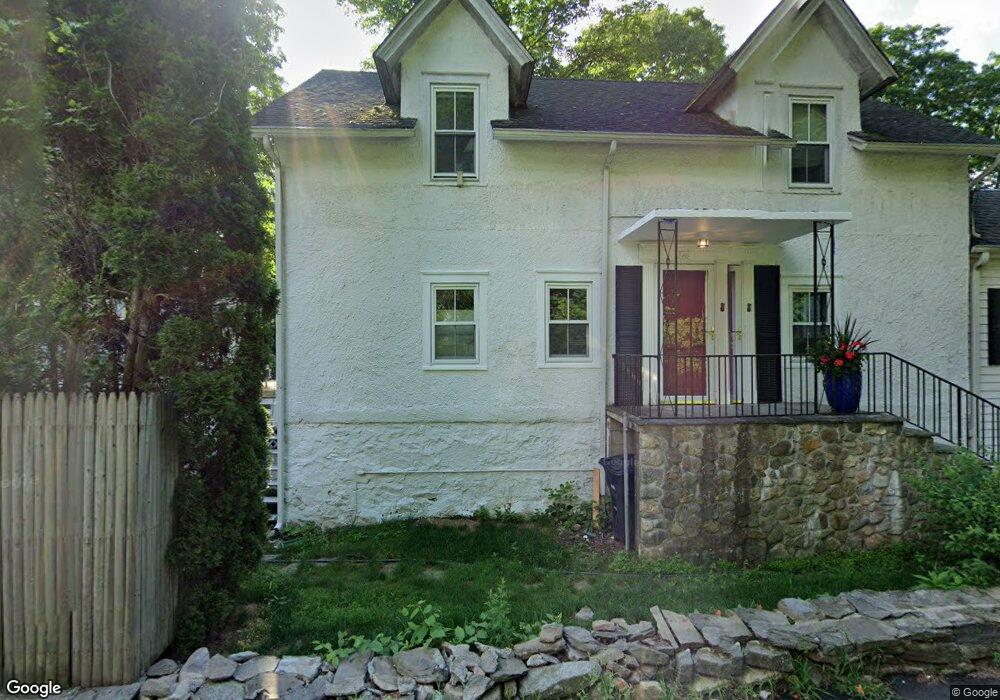
333 Valley Rd Cos Cob, CT 06807
Estimated Value: $1,467,000 - $1,932,000
5
Beds
3
Baths
2,307
Sq Ft
$702/Sq Ft
Est. Value
About This Home
This home is located at 333 Valley Rd, Cos Cob, CT 06807 and is currently estimated at $1,619,293, approximately $701 per square foot. 333 Valley Rd is a home located in Fairfield County with nearby schools including North Mianus School, Eastern Middle School, and Greenwich High School.
Ownership History
Date
Name
Owned For
Owner Type
Purchase Details
Closed on
Mar 1, 2010
Sold by
Oconnor 3Rd Stanley J
Bought by
Oiconnor Stanley James
Current Estimated Value
Purchase Details
Closed on
Jul 10, 2003
Sold by
Henklein Joyce C
Bought by
Oconnor Stanley James
Home Financials for this Owner
Home Financials are based on the most recent Mortgage that was taken out on this home.
Original Mortgage
$571,600
Interest Rate
5.45%
Create a Home Valuation Report for This Property
The Home Valuation Report is an in-depth analysis detailing your home's value as well as a comparison with similar homes in the area
Home Values in the Area
Average Home Value in this Area
Purchase History
We collect this data history from publicly available records. To have your information removed, we recommend requesting removal directly through your county’s website.
| Date | Buyer | Sale Price | Title Company |
|---|---|---|---|
| Oiconnor Stanley James | -- | -- | |
| Oconnor Stanley James | $714,500 | -- |
Source: Public Records
Mortgage History
We collect this data history from publicly available records. To have your information removed, we recommend requesting removal directly through your county’s website.
| Date | Status | Borrower | Loan Amount |
|---|---|---|---|
| Open | Oconnor Stanley James | $250,000 | |
| Previous Owner | Oconnor Stanley James | $571,600 | |
| Previous Owner | Oconnor Stanley James | $71,450 |
Source: Public Records
Tax History
| Year | Tax Paid | Tax Assessment Tax Assessment Total Assessment is a certain percentage of the fair market value that is determined by local assessors to be the total taxable value of land and additions on the property. | Land | Improvement |
|---|---|---|---|---|
| 2025 | $7,461 | $603,680 | $424,690 | $178,990 |
| 2024 | $7,206 | $603,680 | $424,690 | $178,990 |
| 2023 | $7,024 | $603,680 | $424,690 | $178,990 |
| 2022 | $6,960 | $603,680 | $424,690 | $178,990 |
| 2021 | $6,890 | $572,250 | $392,910 | $179,340 |
| 2020 | $6,878 | $572,250 | $392,910 | $179,340 |
| 2019 | $6,947 | $572,250 | $392,910 | $179,340 |
| 2018 | $6,793 | $572,250 | $392,910 | $179,340 |
| 2017 | $6,878 | $572,250 | $392,910 | $179,340 |
| 2016 | $6,769 | $572,250 | $392,910 | $179,340 |
| 2015 | $5,645 | $473,340 | $430,640 | $42,700 |
| 2014 | $5,503 | $473,340 | $430,640 | $42,700 |
Source: Public Records
Map
Nearby Homes
- 47 Ridge St
- 500 River Rd Unit 3
- 98 Hillcrest Park Rd
- 12 Ricki-Beth Ln
- 251 Palmer Hill Rd
- 70 Gregory Rd
- 120 Florence Rd
- 48 N Ridge Rd
- 9 Walnut St
- 681 River Rd
- 185 Valley Rd
- 86 Dandy Dr
- 47 Summit Ridge Rd
- 112 Sheephill Rd
- 74 Long Meadow Rd
- 110 Sheephill Rd
- 14 Pond Place
- 58 Stirrup Ln Unit 58
- 2 Daffodil Ln
- 143 Palmers Hill Rd
- 331 Valley Rd
- 327 Valley Rd
- 335 Valley Rd
- 337 Valley Rd
- 320 Valley Rd
- 84 Ridge St
- 57 Sundance Dr
- 348 Valley Rd
- 318 Valley Rd
- 42 Ridge St
- 341 Valley Rd
- 346 Valley Rd
- 13 Deluca Dr
- 316 Valley Rd
- 8 Deluca Dr
- 340 Valley Rd Unit 10
- 340 Valley Rd Unit 9
- 340 Valley Rd Unit 8
- 340 Valley Rd Unit 7
- 340 Valley Rd Unit 6
Your Personal Tour Guide
Ask me questions while you tour the home.