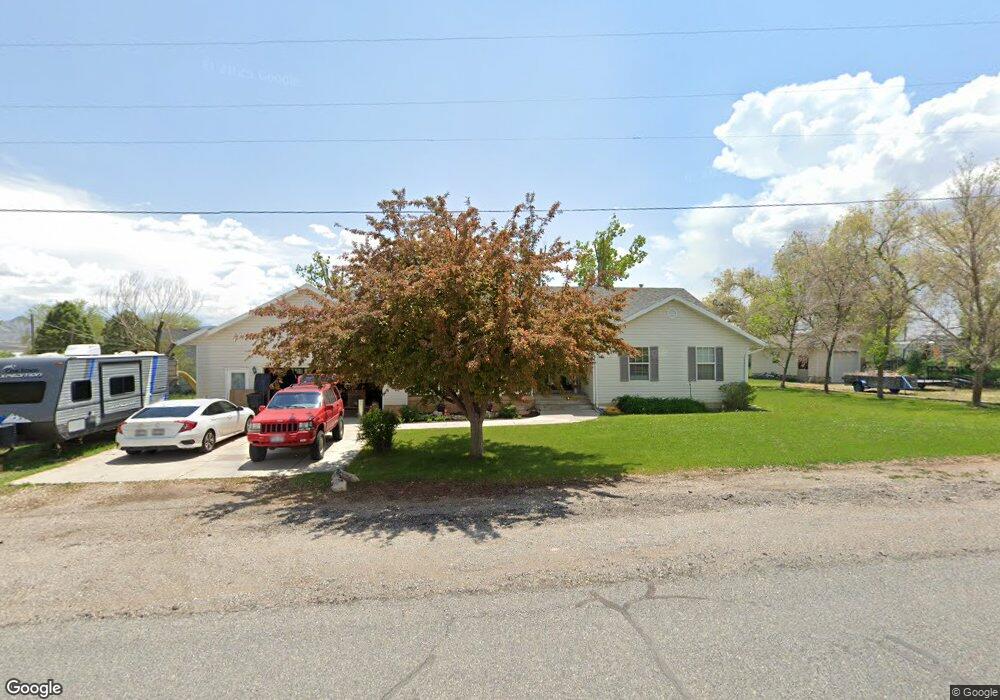
333 W 100 N Aurora, UT 84620
Estimated Value: $453,000 - $488,802
5
Beds
3
Baths
3,602
Sq Ft
$130/Sq Ft
Est. Value
About This Home
This home is located at 333 W 100 N, Aurora, UT 84620 and is currently estimated at $466,701, approximately $129 per square foot. 333 W 100 N is a home located in Sevier County with nearby schools including Salina School, North Sevier Middle School, and North Sevier High School.
Ownership History
Date
Name
Owned For
Owner Type
Purchase Details
Closed on
Nov 6, 2024
Sold by
Duane J Mangum Separate Property Revocab and Mangum Duane J
Bought by
Stubbs Stephanie J and Stubbs Britt J
Current Estimated Value
Home Financials for this Owner
Home Financials are based on the most recent Mortgage that was taken out on this home.
Original Mortgage
$26,746
Outstanding Balance
$26,395
Interest Rate
6.08%
Estimated Equity
$440,306
Purchase Details
Closed on
Aug 2, 2021
Sold by
Mangurn Duane J
Bought by
Mangum Duane J and Duane J Mangum Revocable Trus
Purchase Details
Closed on
Dec 17, 2018
Sold by
Knight George H and Knight Mary Jayne
Bought by
Mangum Duane J
Purchase Details
Closed on
Jan 30, 2017
Sold by
Draper Kelvin G and Draper Moana W
Bought by
Knight George H and Knight Mary Jayne
Create a Home Valuation Report for This Property
The Home Valuation Report is an in-depth analysis detailing your home's value as well as a comparison with similar homes in the area
Purchase History
| Date | Buyer | Sale Price | Title Company |
|---|---|---|---|
| Stubbs Stephanie J | -- | First American Title | |
| Stubbs Stephanie J | -- | First American Title | |
| Mangum Duane J | -- | None Available | |
| Mangum Duane J | -- | None Available | |
| Knight George H | -- | First American Title Insuran |
Source: Public Records
Mortgage History
| Date | Status | Borrower | Loan Amount |
|---|---|---|---|
| Open | Stubbs Stephanie J | $26,746 | |
| Closed | Stubbs Stephanie J | $26,746 | |
| Open | Stubbs Stephanie J | $445,776 | |
| Closed | Stubbs Stephanie J | $445,776 |
Source: Public Records
Tax History
| Year | Tax Paid | Tax Assessment Tax Assessment Total Assessment is a certain percentage of the fair market value that is determined by local assessors to be the total taxable value of land and additions on the property. | Land | Improvement |
|---|---|---|---|---|
| 2025 | $2,270 | $261,091 | $36,524 | $224,567 |
| 2024 | $2,270 | $249,543 | $33,607 | $215,936 |
| 2023 | $2,212 | $263,159 | $31,458 | $231,701 |
| 2022 | $2,528 | $253,734 | $28,426 | $225,308 |
| 2021 | $2,173 | $181,106 | $19,058 | $162,048 |
| 2020 | $1,875 | $146,802 | $19,058 | $127,744 |
| 2019 | $1,724 | $144,230 | $19,060 | $125,170 |
| 2018 | $1,652 | $122,780 | $16,340 | $106,440 |
| 2017 | $1,627 | $115,470 | $16,340 | $99,130 |
| 2016 | $1,194 | $104,780 | $0 | $0 |
| 2015 | $1,194 | $104,780 | $0 | $0 |
| 2014 | $1,194 | $108,400 | $0 | $0 |
Source: Public Records
Map
Nearby Homes
- 376 W 200 N
- 57 N 100 W
- 111 S 200 W
- 40 N 100 W
- 75 E 200 N
- 117 E 350 N
- 268 S 250 E
- 2200 N Hwy 260 (Approximately) W
- 2203 S 1770 W Unit 1
- 79 S 250 E
- 2720 N 250 E Unit 116
- 305 E 2690 N
- 2220 N State St Unit 14
- 1598 N North State St
- 625 W Main St
- Tbd S State St Unit LotWP001
- 36 W 1420 N
- 630 W 285 N
- 268 N Salina Creek Dr
- 372 Maple Dr
Your Personal Tour Guide
Ask me questions while you tour the home.