Estimated Value: $392,000 - $431,000
4
Beds
2
Baths
2,128
Sq Ft
$193/Sq Ft
Est. Value
About This Home
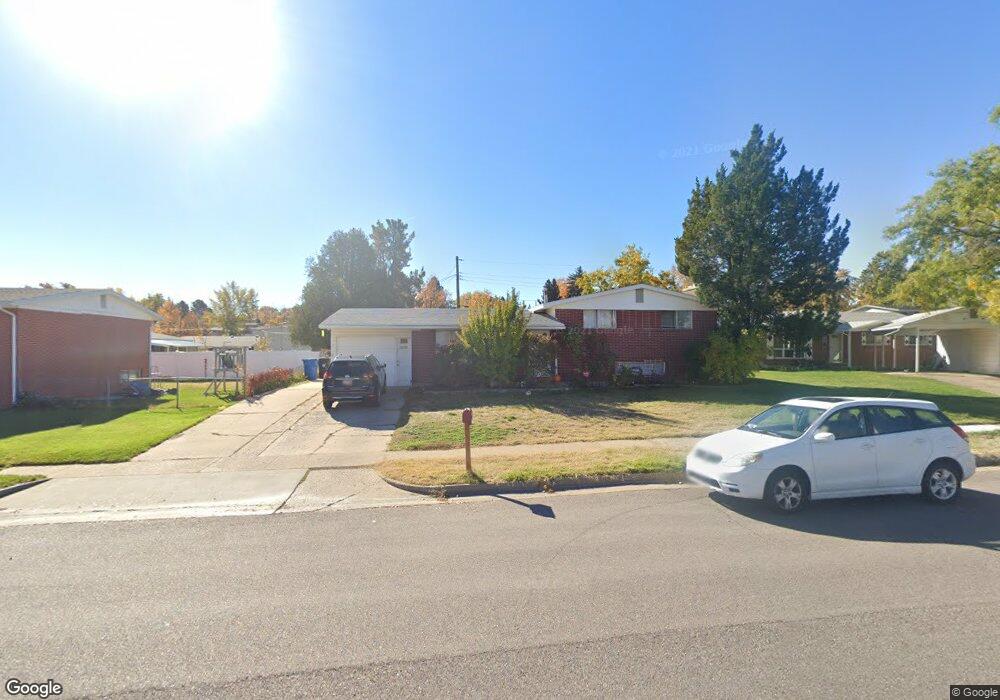
This home is located at 333 W 5200 S, Ogden, UT 84405 and is currently estimated at $411,297, approximately $193 per square foot. 333 W 5200 S is a home located in Weber County with nearby schools including Roosevelt School, T.H. Bell Junior High School, and Bonneville High School.
Ownership History
Date
Name
Owned For
Owner Type
Purchase Details
Closed on
Apr 27, 2018
Sold by
Cromar Heather L
Bought by
Mcgowan Chris
Current Estimated Value
Home Financials for this Owner
Home Financials are based on the most recent Mortgage that was taken out on this home.
Original Mortgage
$224,852
Outstanding Balance
$198,249
Interest Rate
5.5%
Mortgage Type
FHA
Estimated Equity
$213,048
Purchase Details
Closed on
Jun 19, 2015
Sold by
Birch Dillon Scott and Birch Shayla
Bought by
Cromar Heather L
Home Financials for this Owner
Home Financials are based on the most recent Mortgage that was taken out on this home.
Original Mortgage
$149,246
Interest Rate
3.62%
Mortgage Type
FHA
Purchase Details
Closed on
Aug 16, 2012
Sold by
Wright Ronnie G and Wright Kathryn B
Bought by
Birch Dillon Scott and Birch Shayla
Home Financials for this Owner
Home Financials are based on the most recent Mortgage that was taken out on this home.
Original Mortgage
$4,830
Interest Rate
3.56%
Mortgage Type
Stand Alone Second
Create a Home Valuation Report for This Property
The Home Valuation Report is an in-depth analysis detailing your home's value as well as a comparison with similar homes in the area
Home Values in the Area
Average Home Value in this Area
Purchase History
| Date | Buyer | Sale Price | Title Company |
|---|---|---|---|
| Mcgowan Chris | -- | Backman Title Services Ltd | |
| Cromar Heather L | -- | Us Title Insurance Agency | |
| Birch Dillon Scott | -- | Lincoln Title Insurance Agen |
Source: Public Records
Mortgage History
| Date | Status | Borrower | Loan Amount |
|---|---|---|---|
| Open | Mcgowan Chris | $224,852 | |
| Previous Owner | Cromar Heather L | $149,246 | |
| Previous Owner | Birch Dillon Scott | $4,830 | |
| Previous Owner | Birch Dillon Scott | $135,500 |
Source: Public Records
Tax History Compared to Growth
Tax History
| Year | Tax Paid | Tax Assessment Tax Assessment Total Assessment is a certain percentage of the fair market value that is determined by local assessors to be the total taxable value of land and additions on the property. | Land | Improvement |
|---|---|---|---|---|
| 2025 | $2,275 | $376,419 | $127,464 | $248,955 |
| 2024 | $2,275 | $202,399 | $70,105 | $132,294 |
| 2023 | $2,184 | $194,150 | $70,518 | $123,632 |
| 2022 | $2,418 | $222,200 | $67,803 | $154,397 |
| 2021 | $1,946 | $294,000 | $63,624 | $230,376 |
| 2020 | $1,815 | $251,000 | $53,868 | $197,132 |
| 2019 | $1,769 | $229,000 | $48,743 | $180,257 |
| 2018 | $1,491 | $190,000 | $48,743 | $141,257 |
| 2017 | $1,363 | $165,000 | $39,952 | $125,048 |
| 2016 | $1,242 | $82,974 | $20,314 | $62,660 |
| 2015 | $1,046 | $68,119 | $20,314 | $47,805 |
| 2014 | $1,019 | $65,740 | $20,314 | $45,426 |
Source: Public Records
Map
Nearby Homes